
Figure 9.
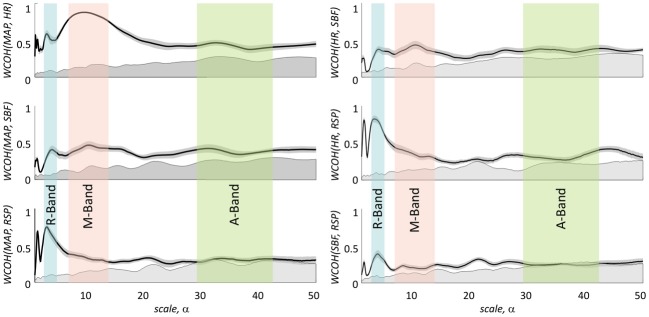
Magnitude values of group average of wavelet coherence between four physiological signals. Left column: in the three rows from top to bottom results for wavelet coherence between MAP and HR, SBF, and RSP are shown, respectively. Right column: in the three rows from top to bottom results for wavelet coherence between HR and SBF, HR and RSP, and SBF and RSP are shown. Light blue, light red, and light green bars indicate the following three time scale ranges: R-band (scales around 3 s and pseudo-frequencies around 0.3 Hz), M-band (scales around 10 s and pseudo-frequencies around 0.1 Hz) and A-band (scales around 35 s and pseudo-frequencies around 0.033 Hz), respectively. The gray shadowed areas around the curves represent standard error of mean for each curve.