
Figure 2.
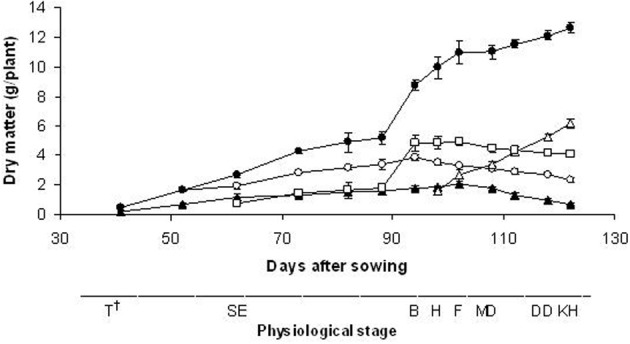
Time-courses of dry matter accumulation patterns of total aerial biomass (•) and plant fractions (○, leaf; □, stem; Δ, ear; ▲, root). Data are means of three replicates, vertical lines represent ±standard error. †T, tillering; SE, stem elongation; B, booting; H, heading; F, flowering; MD, milk development; DD, dough development; KH, kernel hard.