
Figure 3.
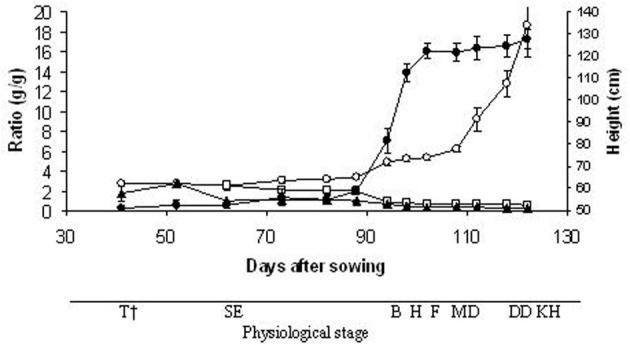
Time-courses of plant height (•), leaf/ stem ratio (□), source/ sink ratio (▲) and shoot/ root ratio (○). Data are means of three replicates, vertical lines represent ±standard error. †T, tillering; SE, stem elongation; B, booting; H, heading; F, flowering; MD, milk development; DD, dough development; KH, kernel hard.