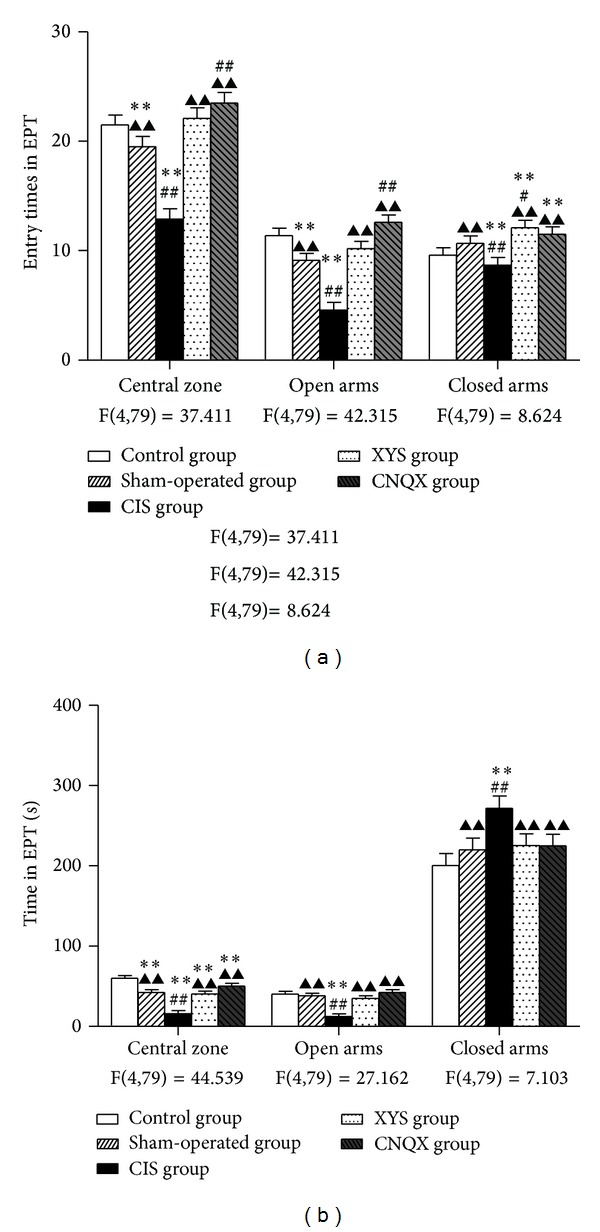
Figure 2.

Performance of rats in the EPM: (a) entry times in central zone, open arms, and closed arms; (b) time spent in central zone, open arms, and closed arms in 5 minutes. Results are expressed as means ± SEM. **P < 0.01 versus control group, # P < 0.05 ## P < 0.01 versus sham-operated group, and ▲▲ P < 0.01 versus CIS group.
