Fig. 3.


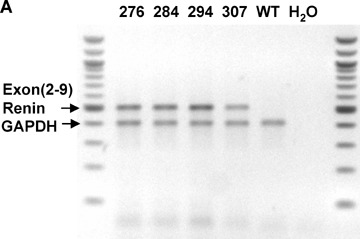
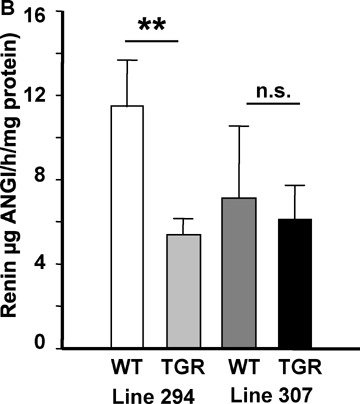
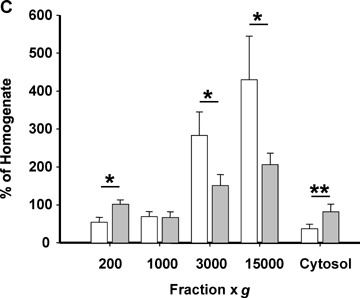
Expression of the exon(2-9)renin transgene and renin levels in the adrenal gland (A): Representative blot showing transgene expression in the adrenal glands of all four lines of TGR and WT controls. (B): Active renin levels in total adrenal gland homogenates from TGR294 and TGR307 as well as their respective controls. **: P<0.01 (TGR versusWT). (C): Enrichment of active renin levels in adrenal sub-cellular fractions of TGR294 (grey bars) compared with WT (open bars). n= 6–9 per group; *: P<0.05 (TGR versus WT); **: P<0.01 (TGR versus WT).
