
Fig. 3.
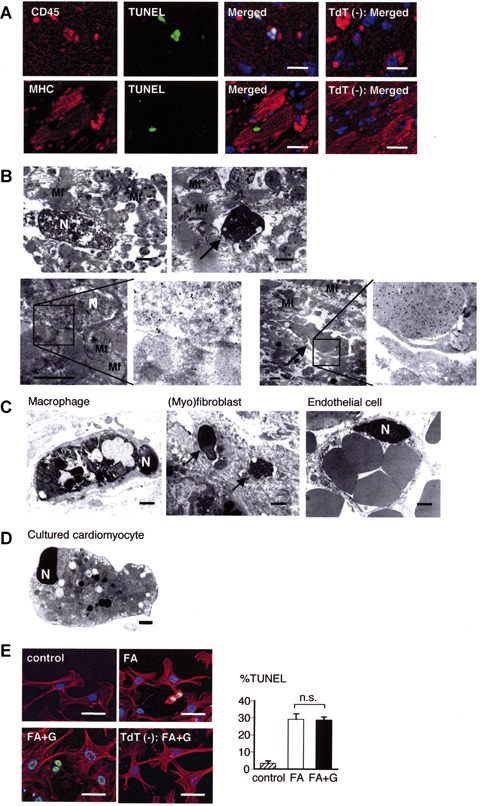
Analysis of cardiomyocyte and non-myocyte death. (A) TUNEL staining of CD45-positive leucocytes and MHC-positive cardiomyocytes on day 1 after MI. Bars, 10 μm. (B) Ultrastructure of infarcted myocardial tissue on day 1 after MI. Upper panels show a necrotic cardiomyocyte and an apoptotic inflammatory cell (arrow) that infiltrated into the necrotic cardiomyocyte. Lower left panels show an EM-TUNEL-positive necrotic cardiomyocyte with immunogold particle accumulation on the nucleus. Lower right panels show an ultrastructurally demonstrated apoptotic inflammatory cell (arrow) invading the necrotic cardiomyocyte; such true apoptotic cells present very strong EM-TUNEL positivity. N, nucleus; Mf, myofibril; Mt, mitochondria. Bars, 1 μm. (C) Ultrastructure of a macrophage, (myo)fibroblast and endothelial cell in the infarcted area showing typical apoptotic features 1 week after MI. Arrows indicate apoptotic bodies of which original cell type is assumed to be (myo)fibroblast because they are surrounded by dense fibrous tissue. Bars, 1 μm. (D) Ultrastructure of cultured neonatal cardiomyocytes subjected to Fas-mediated apoptosis. Bar, 1 μm. (E) Treatment with G-CSF did not affect the incidence of TUNEL-positivity among the cultured cardiomyocytes. Bars, 10 μm.