
Fig. 1.
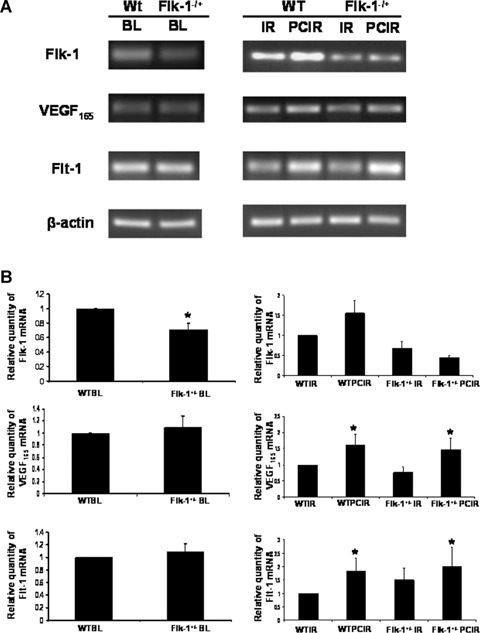
RT-PCR and real-time RT-PCR analysis for Flk-1, Flt-1 and vascular endothelial growth factor (VEGF). (A) Relative abundance (%) of Flk-1, Flt-1 and VEGF mRNA in wild-type (WT) and Flk-1+/− knockout myocardium (n= 6/group) at the baseline level, after ischaemia/reperfusion (IR) and after ischaemic preconditioning (PCIR) followed by IR. (B) Quantitative real-time RT-PCR analysis validating RT-PCR data for VEGF, Flt-1 and Flk-1 mRNA. *P < 0.05 compared with WT ischaemia/reperfusion, #P < 0.05 compared with WT preconditioning, †P < 0.05 compared with KO ischaemia/reperfusion.