
Fig. 6.
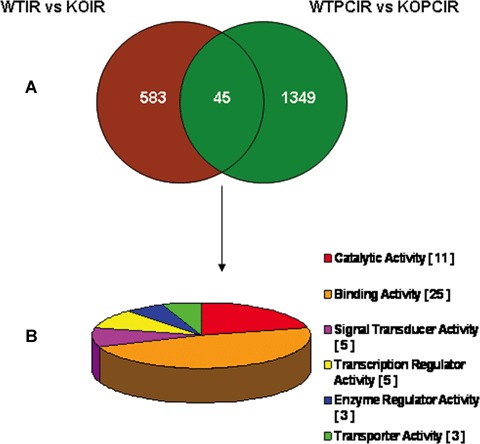
A Venn diagram shows the common differentially expressed genes in between two comparisons, (KO I/R versus WT I/R and KOPCIR versus WT PCIR). (B). Pie chart shows the classification of differentially expressed genes based on biological functions (Netaffx gene ontology tool, Affymetrix). The number represents the genes associated with a specific function. Note that some genes may have multiple functions and be classified in several categories. WTIR, wild-type IR; WTP-CIR, preconditioned wild-type; KOIR, Flk-1+/− knockout IR; KOPCIR, preconditioned Flk1+/− knockout.