
Fig. 7.
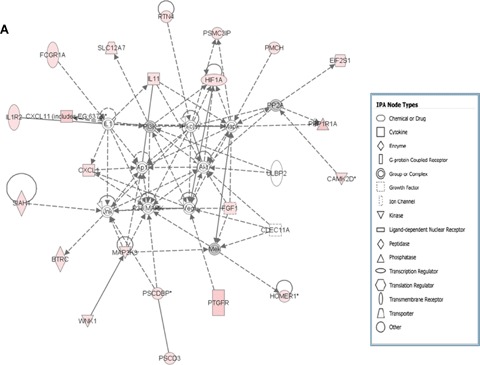
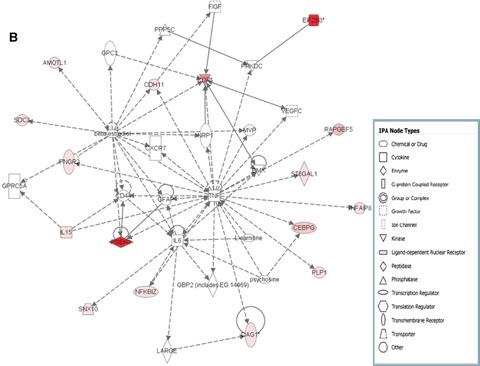
Functionally related gene network constructed from both the comparisons WTIR versus KOIR (A) and WTPCIR versus KOPCIR (B) related with cardiovascular system with the help of IPA 5.0.Nodes represent genes, with their shape representing the functional class of the gene product. All the focus genes are represented by pink and the higher intensity red colour represent lower P-value WTIR, wild-type IR; WTPCIR, preconditioned wild-type; KOIR, Flk-1+/− knockout IR; KOPCIR, preconditioned Flk1+/− knockout.