. 2013 Dec 17;2:e01426. doi: 10.7554/eLife.01426

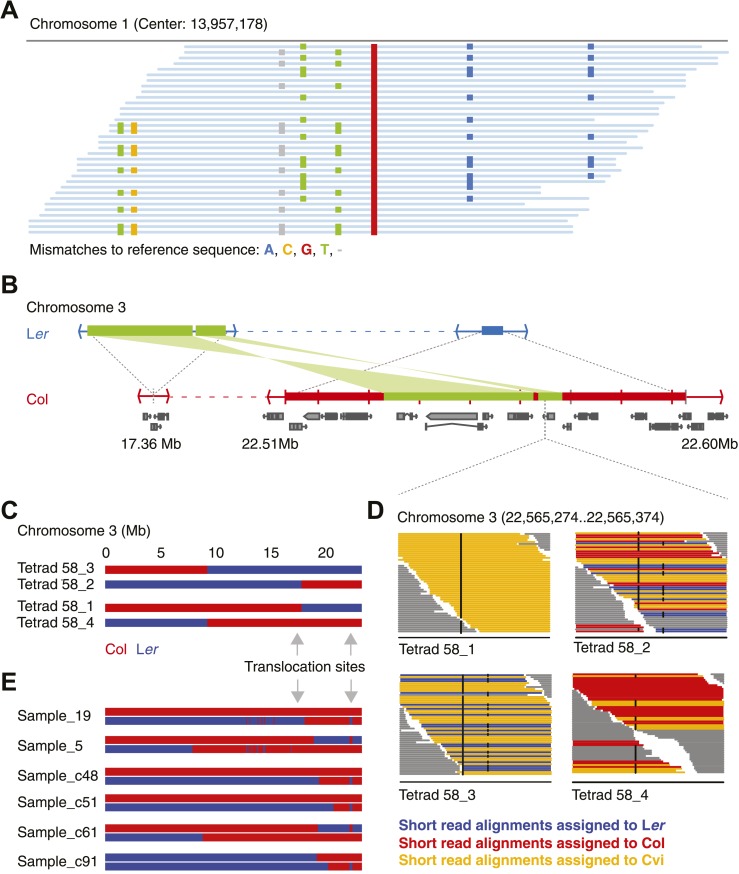
Figure 2. Identification of gene conversions is complex because of unknown duplications and transpositions in the A. thaliana genome.

(A) Short read alignments of Ler against the reference sequence at position 13,957,178 on chromosome 1. Individual reads are shown as blue lines, while mismatches between reference sequence and short reads are colored according to mismatch types. Three distinct Ler haplotypes align to this region, indicating that this sequence is present in triplicate in the Ler genome. As Ler is homozygous, at least two haplotypes were not aligned to their respective origin. (B) The genomic landscape of the two insertion sites of an ∼80 kb transposition between Ler and Col. Blue and red boxes mark sequences that are unique to Ler and Col respectively. Green boxes highlight the transposed (and inverted) DNA. Genes annotated in Col are shown in grey. (C) Graphical genotypes of chromosome 3 of the four genomes of tetrad 58 (Col-derived genomic regions are shown in red, Ler regions in blue). Cvi sequences are not shown. Grey arrows indicate the insertion sites of the transposition illustrated in B. Tetrad 58_1 and tetrad 58_2 formed a crossover between these insertion sites. As a result, tetrad 58_1 lost all transposed sequences, whereas in tetrad 58_2 the transposed DNA is duplicated. (D) Short read alignments of all four genomes of tetrad 58 to chromosome 3 at positions 22,565,274 to 22,565,374, which overlap the transposed DNA. This region includes two closely linked SNPs that can distinguish all three parental alleles (black dots indicate mismatches to the reference sequence). The reads that can be assigned to one of the three parents are shown by different colors. Tetrad 58_1, which lost the transposed DNA, shows the absence of Col and Ler derived reads, whereas tetrad 58_2, which inherited both transposed regions, shows the presence of both Col and Ler alleles in this region. (E) Redrawing of the graphical genotypes of six Col-Ler F2 offspring, as presented in the appendix of Yang et al. (2012). These offspring experienced a putative double CO, co-localizing with the Col insertion site of above-mentioned transposition. Note that in all six F2 offspring, at least one of the recombinant chromosomes features a CO between the transposition sites. This suggests that the annotated double recombinations are not real, but that the observed patterns originate from copy number variation due to transposed DNA.

DOI: http://dx.doi.org/10.7554/eLife.01426.006

Figure 2.

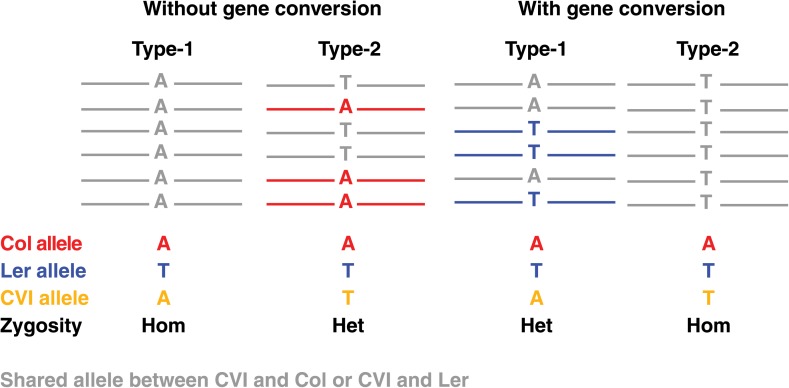
Figure 2—figure supplement 1. Graphical illustration of short read alignments at type-1 and type-2 markers revealing no NCO–GCs (two loci at the left) and the same loci revealing type-1 and type-2 NCO-GCs (right).

Figure 2—figure supplement 1.

Short read alignments are shown in colors according to the respective genome, if they cannot be uniquely assigned to one unique parent they are shown in grey. At type-1 markers, the expected allele of the recombinant Col or Ler chromosome is similar to the Cvi allele. This leads to a homozygous genotype (left). At type-2 markers, Cvi is different from the expected allele and a heterozygous marker is observed (second from left). In contrast, in the case of GCs, type-1 markers will reveal an additional allele, whereas type-2 markers will feature the absence of an expected allele (two loci on the right).
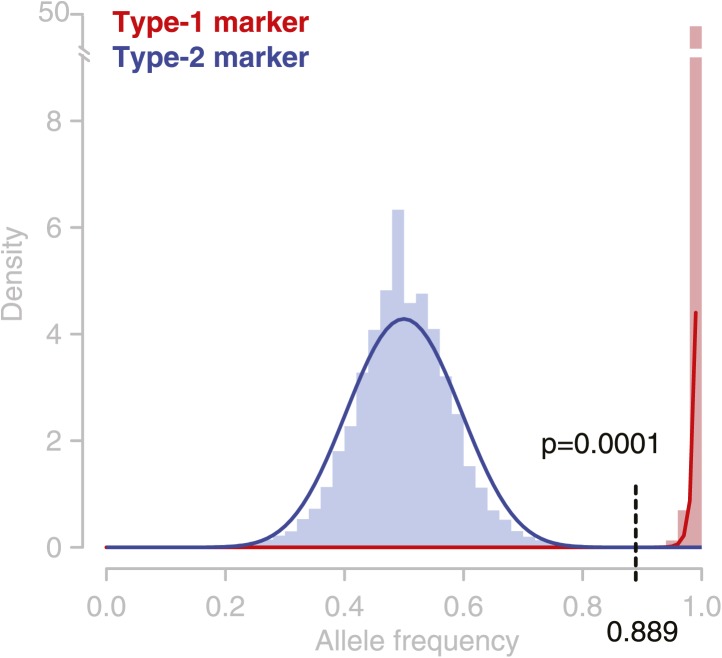
Figure 2—figure supplement 2. Observed allele distribution throughout all deeply sequenced tetrad genomes.

Figure 2—figure supplement 2.

Observed allele frequencies (AFs) were derived from allele counts (based on short read alignments) at the respective marker loci. AFs at type-1 markers (homozygous alleles) are shown in red, AFs at type-2 markers in blue (heterozygous alleles). Blue and red lines are beta distributions fitted to the observed AF distributions. These were used as probability functions for short read-based AFs. At an allele frequency of 0.889 the percentiles of the two probability functions were almost similar. Hence, assigning heterozygous and homozygous alleles based on this frequency cutoff has an almost similar accuracy for type-1 and type-2 markers, and the error rate of GC assignment at type-1 and type-2 markers is expected to be equal.
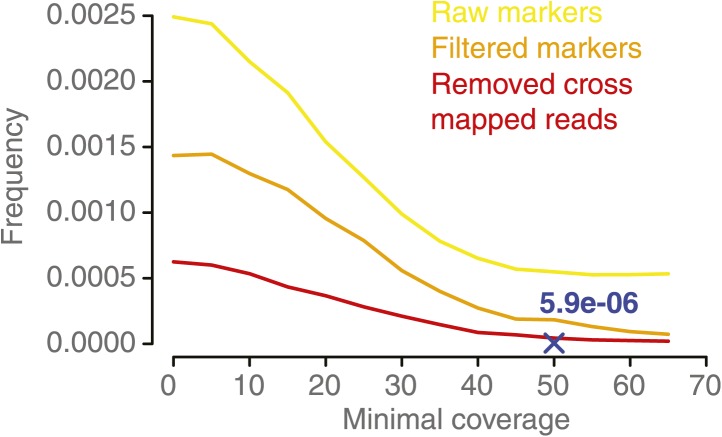
Figure 2—figure supplement 3. NCO–GC frequency per marker per meiosis measured in the five deeply sequenced tetrads, using a range of minimal coverage thresholds and three different marker sets.

Figure 2—figure supplement 3.

NCO–GC frequency was assessed using different marker sets. Marker sets with more stringent filtering showed a lower frequency of putative NCO–GCs, which indicates that filtering reduces the incidence of false positives. For all sets we observed that too low minimal coverage thresholds (for assigning either a NCO–GC or no NCO–GC) led to increased putative NCO–GC frequencies. NCO–GC frequency leveled off beyond a coverage requirement of 50x for all marker sets. The blue cross indicates the estimated NCO–GC frequency, based on all PCR-validated NCO–GCs.
Figure 2—figure supplement 4. The number of putative type-1 and type-2 NCO–GCs in all 20 deeply sequenced tetrad offspring using different marker sets.

Figure 2—figure supplement 4.

Bar charts show the number of NCO–GC detected per offspring plant using different marker set generated with different filter stringencies in each subsequent step (top to bottom). Quality score filtered marker sets revealed an overrepresentation of type-1 NCO–GC (top panel). Even after filtering for markers in close vicinity to putatively duplicated regions, some samples still showed a relative high incidence of type-1 markers (2nd panel). After removing markers with falsely aligned reads (using regions where all three parental alleles could be distinguished) and regions of high sequence divergence, the overall number of NCO–GCs was drastically reduced, however the ratio of type-1 and type-2 markers is close to equal, as theoretically expected (3rd panel).
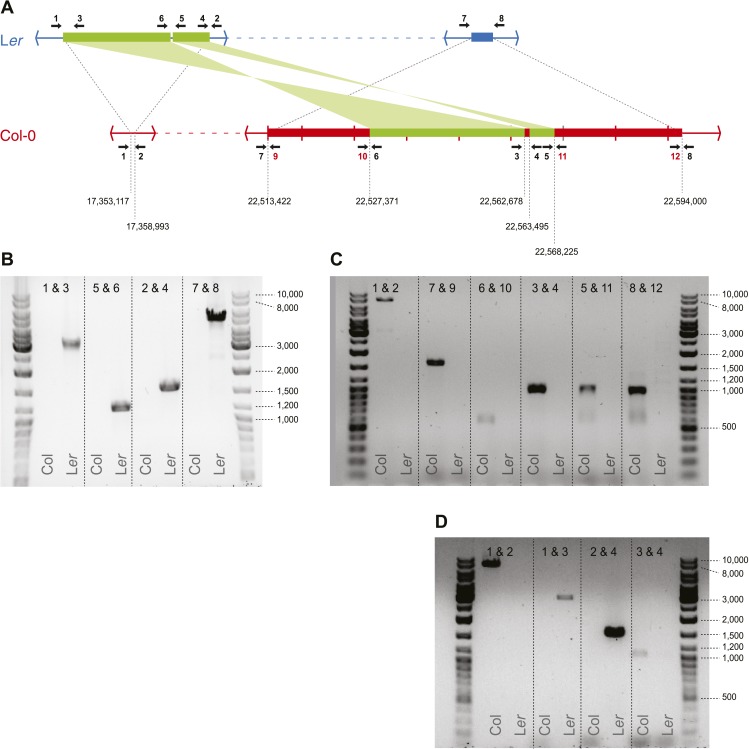
Figure 2—figure supplement 5. Transposed sequences on A. thaliana chromosome 3.

Figure 2—figure supplement 5.

(A) Upper panel shows, analogous to Figure 2B, the location of transposed DNA between the two parental lines Ler and Col. Thin blue and red lines indicate co-linear sequences. Green thick lines show shared, albeit transposed and inverted sequences. Thick blue and red lines show sequences unique to Ler or Col respectively. Numbered arrows indicate primer positions used for verification of transposed sequences. Primer positions with black numbers refer to primers present in both Col and Ler, whereas red numbers indicate Col-specific primers. Tick marks in Col describe 10 kb distances and numbers below the Col sequence refer to the approximate transposition breakpoints in the Col reference genome. (B) Primer pairs that give a product in Ler but not in Col. (C) Primer pairs that give a product in Col but not in Ler. The fragment generated by primers 1 and 2 measures ∼9 kb on gel, while based on the Col reference we expected 7,9 Kb. We therefore designed a second (independent) set of primers for positions 1, 2, 3, and 4 and repeated the PCRs for these primer combinations (D). All fragments were of similar size as the fragments shown in B and C, corroborating the slightly longer than expected length for the product by primers 1 and 2.
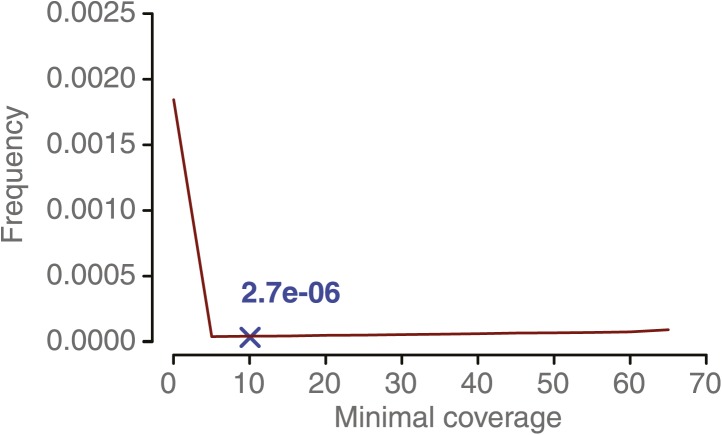
Figure 2—figure supplement 6. NCO–GC frequency per marker per meiosis measured in 10 recombinant DH lines at increasing minimal coverage thresholds.

Figure 2—figure supplement 6.

From a minimal coverage threshold of 10 onwards, the observed frequency of putative NCO–GC does not majorly change. This is in contrast to the minimal coverage requirement for the tetrad sample analysis. The reasons for this lie in the homozygous nature of the DH samples, that makes identification of NCO–GCs much easier in comparison to the tetrad samples. The blue cross indicates the estimated NCO–GC frequency after PCR validating all predicted NCO–GCs.