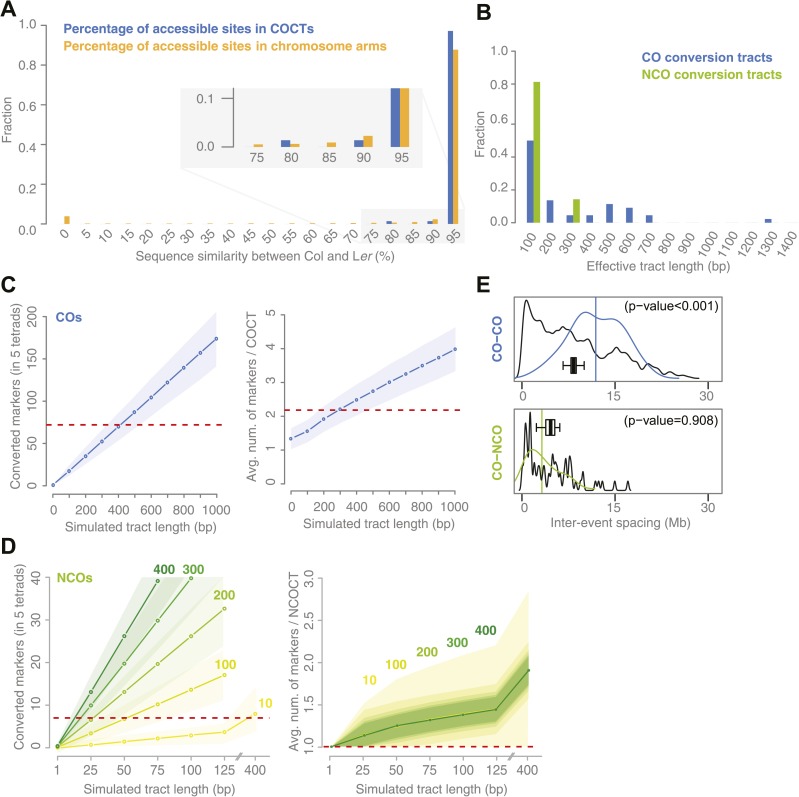
Figure 3. Sequence similarity at recombination sites, length differences between COCTs and NCOCTs and crossover interference.
(A) The percentage of confidently aligned positions within the resequencing of Ler was used as proxy for local sequence similarity. The percentages at COs were compared to a background distribution based on random sampling in non-peri-centromeric regions. (B) Comparison of COCT and NCOCT lengths. COCTs are significantly longer. (C) Repeatedly simulating (n = 10,000) sets of 52 COs randomly placed in the non-peri-centromeric regions predicted the average number of converted markers throughout all COCTs (left) as well as the average number of co-converted markers within a single COCT (right) given a fixed, simulated tract length (blue lines show the average values, shaded regions indicate standard deviations). The dashed red lines indicate the observed values for the real number of converted markers and average number of markers that co-converted. The intersections of observed and simulated numbers suggest an average COCT length of ∼300–400 bp. (D) Estimation of NCOCT length, as shown for COCTs in C. As the absolute number of NCOs is not obvious, we simulated a range of different NCO numbers (green to yellow colors indicate different numbers of DSBs per meiosis, of which half are simulated not to restore the original allele). Assuming a NCOCTs length of ∼400 bp (as we estimated for COCT length), only five NCOs would be formed per meiosis (left), however in this scenario the average number of co-converted markers would deviate drastically from the observed value (right). (E) The density distribution of distances between neighboring CO and between neighboring CO and NCO events reveals differences in inter-event spacing. The observed distances between recombination events (colored), with the average inter-event distance shown as a vertical line, are compared to randomized inter-event distances (black lines) measured after randomizing the labels of the existing tetrads. The boxplots show the distribution of the means of each randomization. The CO–CO distances are significantly longer than random distances due to crossover interference. Interference between COs and NCOs could not be detected.

