
Figure 2. Effect size distribution: Single-group pre-post design (n = 12).
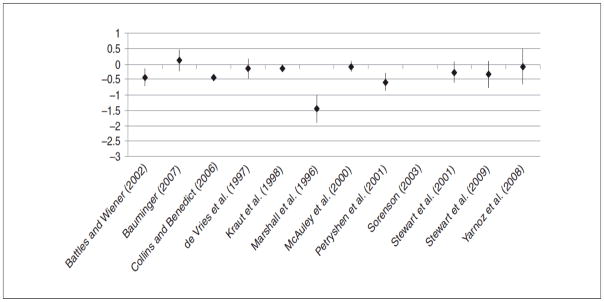
Note: To make the graphs comparable, the y-axis was set at (1.0 to −3.0). The result from one study with a larger effect size (−4.81) is therefore not fully demonstrated in this graph (Sorenson, 2003).