Figure 1.
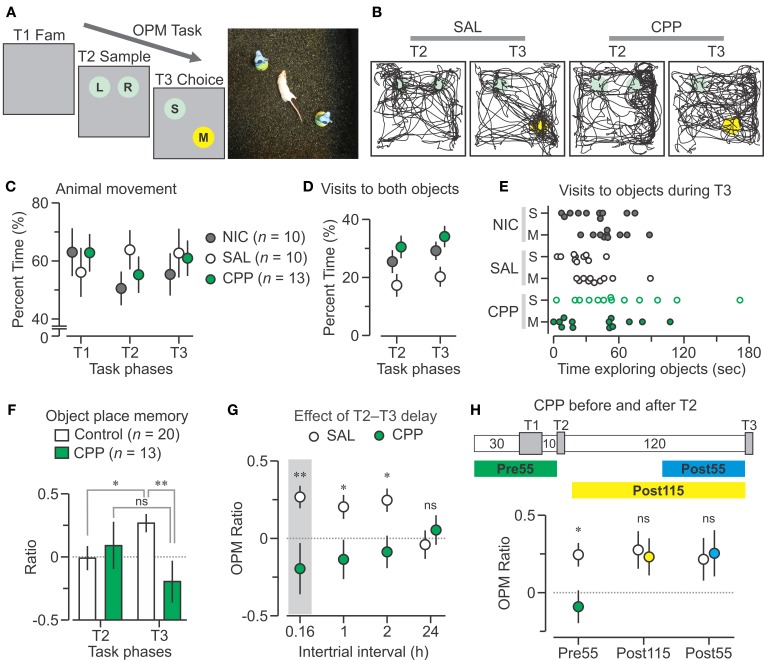
CPP disrupts the OPM task. (A) Left, schematic of the object place memory (OPM) protocol comprising a familiarization trial (T1 Fam., 15 min), sample (T2, 5 min), and choice (T3, 5 min), separated by 10-min delays. Right, top view of a mouse performing a choice trial within the square chamber (40 cm on the side). (B) Track plots of T2 and T3 for mice injected with saline (SAL, 0.9%) and CPP (10 mg per kg, 2.5 mg per mL in 0.9% saline). The SAL animal preferentially explores the moved object in T3, whereas the CPP mouse does not. Circles represent locations of the objects; colors, as in (A). (C) Graph showing the percent time (mean ± s.e.m.) the animals spend moving during the trials; NIC, non-injected group. (D) Percent time (mean ± s.e.m.) of the combined visits to both objects during T2 and T3. (E) Graph for the time spent exploring the objects during T3 for each animal. (F) Discrimination ratios (mean ± s.e.m.) plotted across T2 and T3 showing that Control mice (SAL plus NIC) have a robust bias for the moved object on T3, whereas CCP mice do not. (G) OPM ratios (mean ± s.e.m.) for different delays between T2 and T3. The shaded area represents the T3 data from (F). (H) Top, diagram of the time course of the task with injection of CPP 55 min before T2 (Pre55), 115 min before T3 (Post115) or 55 min before T3 (Post55). Bottom, OPM ratios (mean ± s.e.m.) for the CPP treatments. Abbreviations, L, left object; M, moved object; R, right object; S, static object; ns, non-significant; *, P < 0.005; **, P < 0.001 (t-test).

