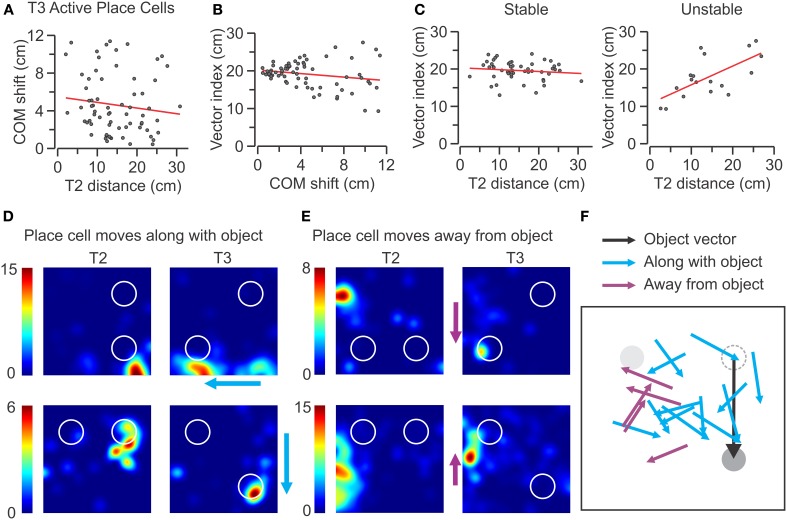
Figure 10.
Effect of object proximity on COM shift of place fields in T3. (A–C) Scatter plots for active place cells from the SAL group recorded in T3 (n = 69). The red lines indicate linear regressions. (A) COM shift vs. T2 distance to the moving object for active SAL cells shows no correlation between terms (r = −0.03). (B) Vector index vs. COM shift shows negligible correlation (r = −0.17). (C) Active SAL cells are segregated into stable (left) and unstable (right) classes. No significant correlation is observed for stable units (n = 51, r = −0.07), whereas unstable units have a significantly positive correlation between vector difference and T2 distance to moving object (n = 18, r = 0.64, P < 0.01). (D) Representative rate maps of unstable place cells that follow the movement of the object during T3. The color scale (at left of each map) indicates the firing rate in Hz. (E) Rate maps for place cells that move away from the moving object during T3. Color scale as in (D). (F) Diagrammatic representation of place cells that move along with the object and cells that move away from it. In the diagram, the objects (in T2) are aligned to the NW (gray), and NE (dashed) sectors, although they were tested in all the quadrants. The moving object (in T3) is represented along the object vector (black line).

