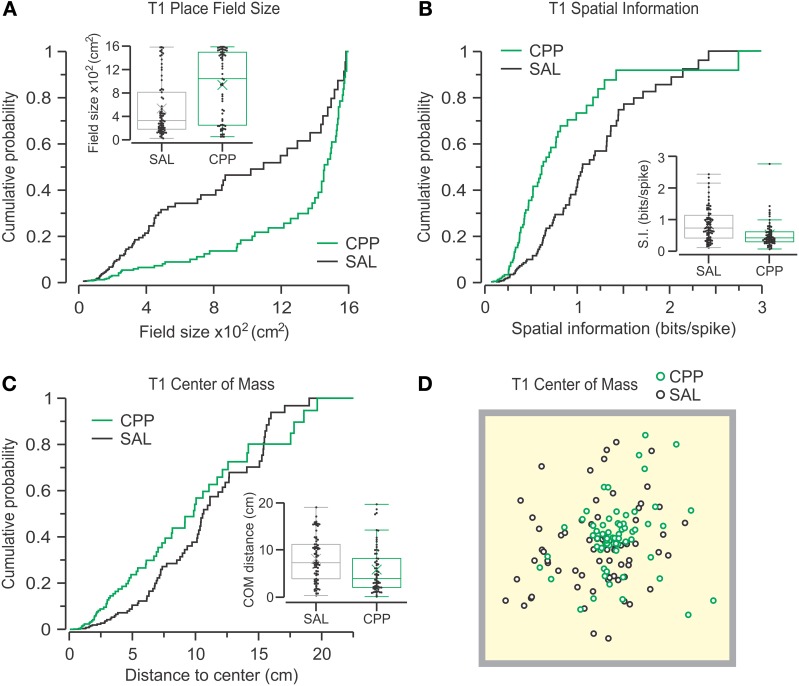
Figure 6.
CPP alters place cell properties during T1. Cumulative probability distributions and box plots (insets) are used to display the parameters under analysis for active CPP (n = 64) and SAL (n = 73) units. (A) Place fields are defined as contiguous areas >0.1 of peak firing rate that contain the peak firing rate (no additional fields included). Place field sizes are highly different between groups (P = 9.2 × 10⁻⁵, KS test). (B) Spatial information is significantly different between groups (P = 1.3 × 10⁻⁴, KS test). (C) The distance between the place field's center-of-mass and the arena center also shows significant difference (P = 3.4 × 10⁻³, KS test). (D) Top view of the behavioral arena (40 cm on the side) with the centers-of-mass for all active units distributed throughout the chamber.

