Figure 9.
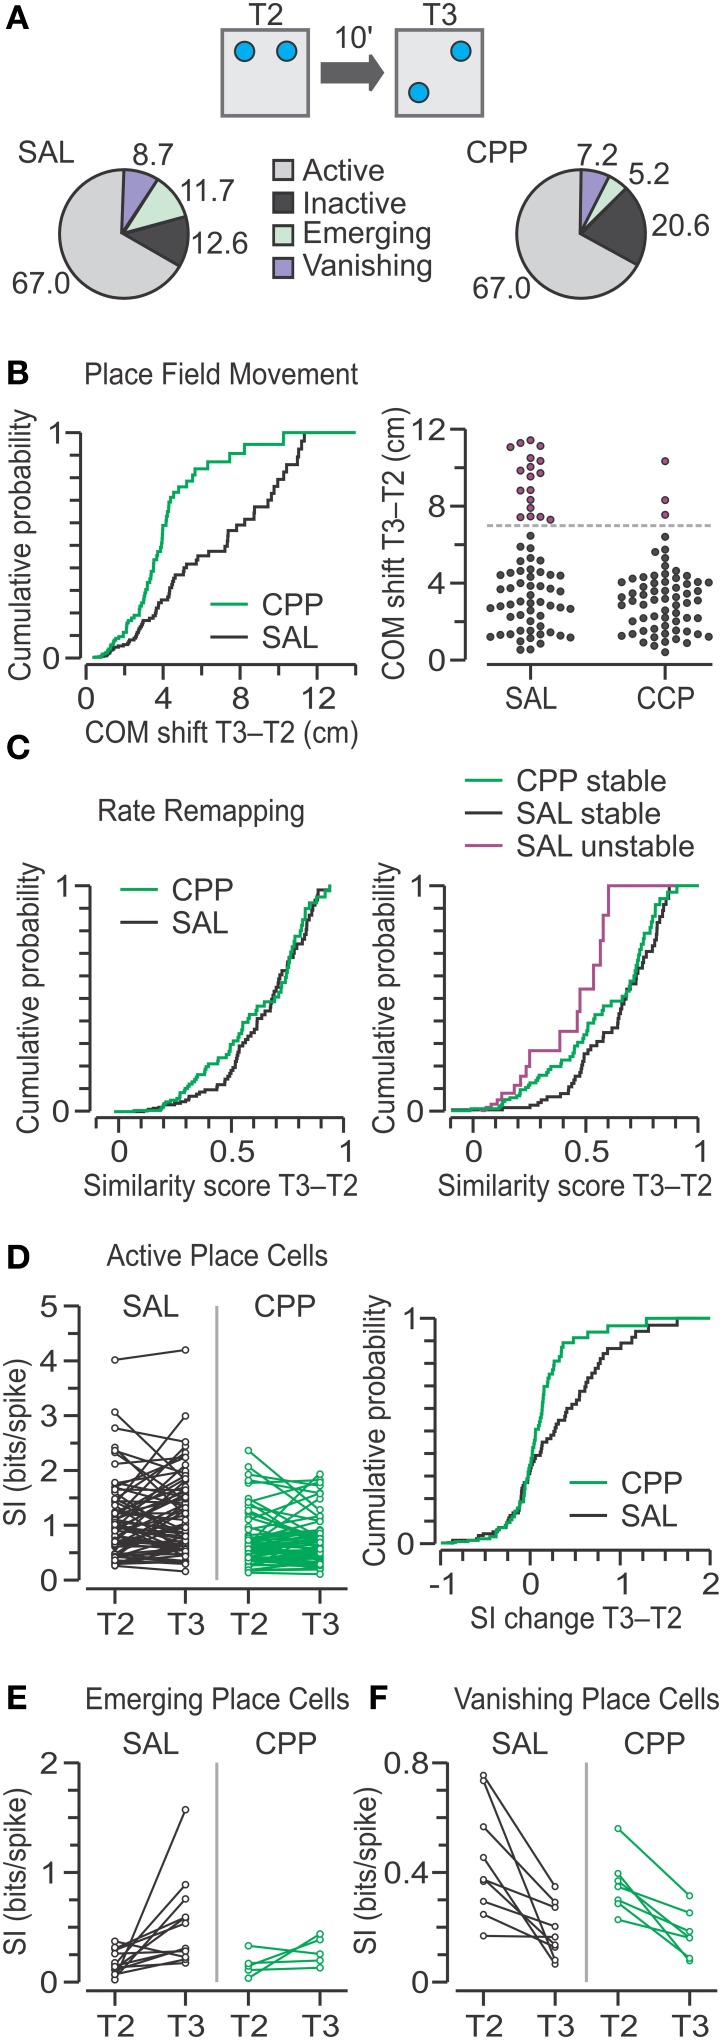
Place cell responses to object movement in T3. (A) Top, schematic of the T2–T3 transition in the OPM task, with objects represented by blue circles. Bottom, pie charts with classes of units based on the activity between T2 and T3. Numbers represent the percentage from total for SAL (n = 103) and CPP (n = 97) units. There are no significant frequency differences between groups (chi square-test). (B) Left, distributions of COM shifts in active place cells for SAL (n = 69) and CPP (n = 65) groups are significantly different (P < 0.005, KS test). Right, agglomerative clustering of COM shifts yields two subsets, stable (black circles) and unstable (purple circles) units, for both the SAL and CPP groups, which are separated by the dashed line. When grouped in this manner, there are significant frequency differences between groups (P < 0.005, chi square-test). (C) Left, distributions of similarity scores for active SAL and CPP groups show no statistical difference (P = 0.23, KS test). Right, distributions of similarity scores, segregated into stable and unstable classes, reveal a large difference between stable (n = 51) and unstable (n = 18) SAL cells (P < 0.001, KS test). Moreover, stable CPP cells (n = 62) are mildly different than stable SAL cells (P < 0.02, KS test). (D) Left, spatial information (SI) for active place cells in T2 and T3. Right, distributions of SI change for active units with a slightly lower SI change for CPP cells (P < 0.04, KS test). (E) SI for emerging place cells in the SAL (n = 12) and CPP groups (n = 5) in T2 and T3. (F) SI for vanishing place cells in the SAL (n = 9) and CPP groups (n = 7) in T2 and T3.

