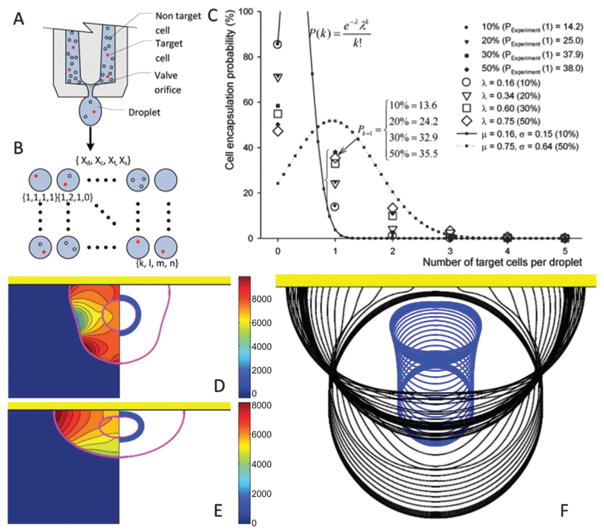
Fig. 5.
Statistical and computational modeling of cell encapsulation and the printing process. (A–C) P(Xt) (eqn (3.6) in ref. 86) are cell encapsulation probability functions for the heterogeneous cell mixture including several cell loading concentrations. (A) Heterogeneous mixture of target and non-target cells inside an ejector reservoir. (B) Four parameters were distributed onto a matrix: (Xd) the number of droplets that contain cells, (Xc) number of cells per droplet, (Xt) number of target cells, and (Xs) droplets encapsulating a single target cell. (C) Cell encapsulation probability, P(Xt), as a function of number of target cells per droplet for cell concentration = 1.5 × 10⁵ cells per mL. (D–F) Inner droplet representing the cell was assumed to be a highly viscous fluid and non-wetting (not sticking to the surface) while encapsulating droplets partially wetted the substrate. A moving contact line model90,238 was utilized to predict the dynamic contact angle. (D and E) Pressure contours and pressure distribution on the cell were plotted at the left half and the right half, respectively. Shear stresses peaked in the vicinity of the triple point during the initial phase of droplet–surface interaction. Triple point is the point where outer droplets, receiving substrate and ambient air, coincide. Maximum pressure was located near the contact line just before recoiling, and migrated to the distal end from the receiving surface where it stayed there until the recoil phase. Governing non-dimensional numbers are: We = 0.5, Re = 30, do/di = 2.85, σo/σi = 2541, μc/μd = 10. (F) Sequential impact images of cell encapsulating droplets. (A–C) are reproduced with permission86 and (D–F) are reproduced with permission.89

