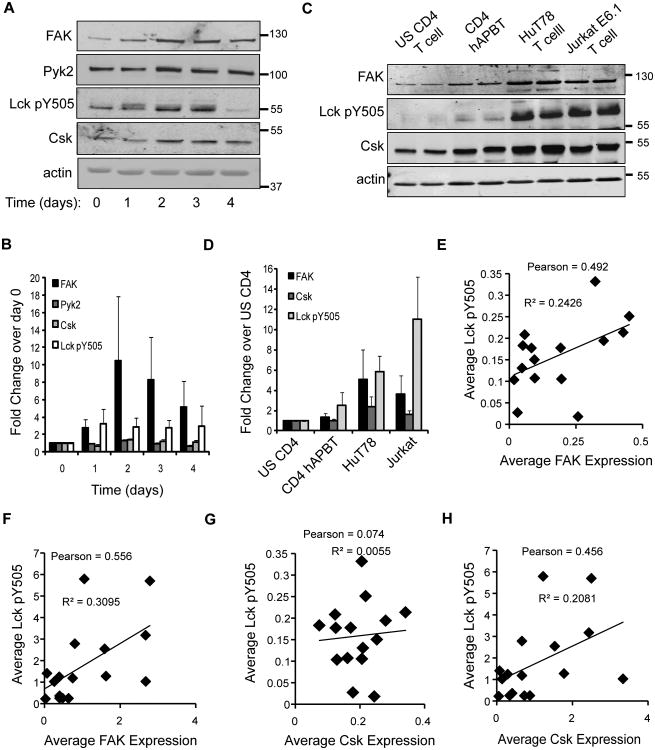
Figure 10.
FAK expression correlates with the phosphorylation of Lck tyrosine 505. A, Primary human CD4 T cells were activated in culture with magnetic beads coated with anti-CD3 and anti-CD28 in the presence of 100 U/ml recombinant IL-2 for the indicated times. The expression of FAK, Pyk2, Csk, Lck Y505, or actin was assessed by immunoblotting. B, The expression of the proteins was normalized to actin expression. The fold change in protein expression relative to day 0 stimulation was then calculated. The data is shown as mean of three experiments ± s.e.m. C, Equal numbers of freshly isolated CD4 T cells (US CD4 T cell), CD4 T cells activated for 6 days with anti-CD3 and anti-CD28-coated beads (CD4 hAPBT), unstimulated HuT78 T cells, or unstimulated Jurkat E6.1 T cells were lysed. Immunoblotting was then used to examine FAK, phospho-Lck Y505, Lck, Csk, or actin expression. D, Relative expression of the various proteins was calculated as in (B). Fold change in protein expression relative to unstimulated (US) CD4 T cell sample was calculated, and the mean of four experiments ± s.e.m. is shown. E-H Linear regression and Pearson Correlation analyses were used to examine the relationship between Lck Y505 phosphorylation and average FAK expression or average Csk expression in CD4 T cells (E and G) or in CD4 T cells and human T cell lines (F and H).

