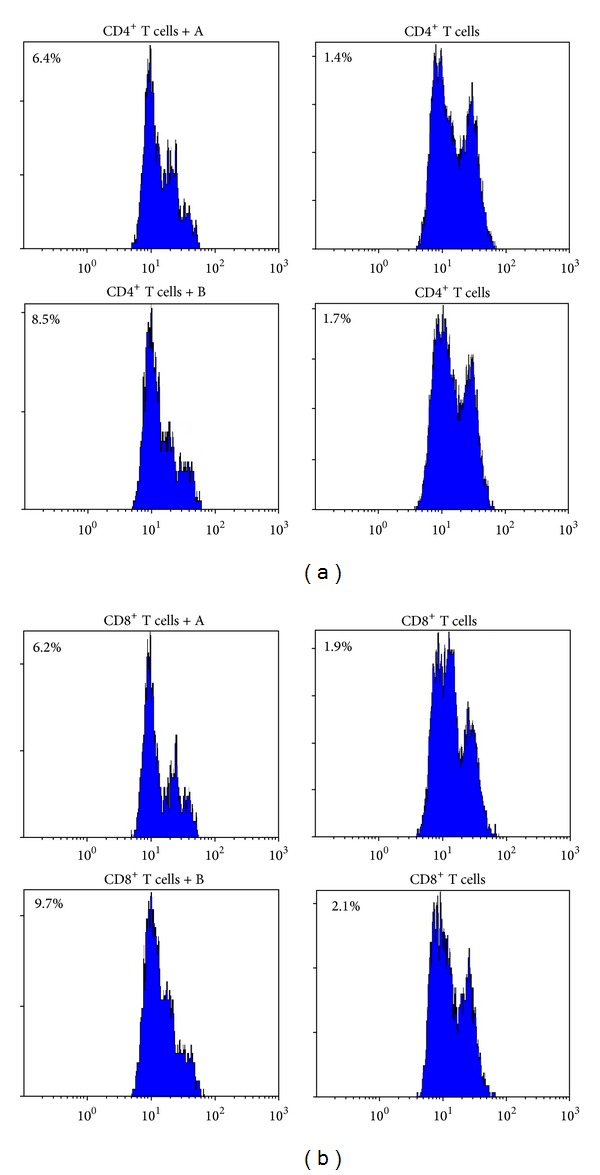
Figure 3.

FCM analysis of suppressive Treg cells in vitro; (a) the suppression for CD4+ T cells by FCM analysis; (b) the suppression for CD8+ T cells by FCM analysis. The Treg cells were isolated from patient 5 (“A” means the Treg cells from the patient who was not given the rapamycin treatment; “B” means the Treg cells from the same patient who obtained CR), and their freshly purified autologous effector CD4+ T or CD8+ T cells were stimulated with anti-CD3 and anti-CD28. They were cocultured in culture medium. The cell division was assessed at day 5 after stimulation by FACS analysis of CFSE dilution. Suppression of responder cell proliferation is indicated as %.
