
Fig. 4.
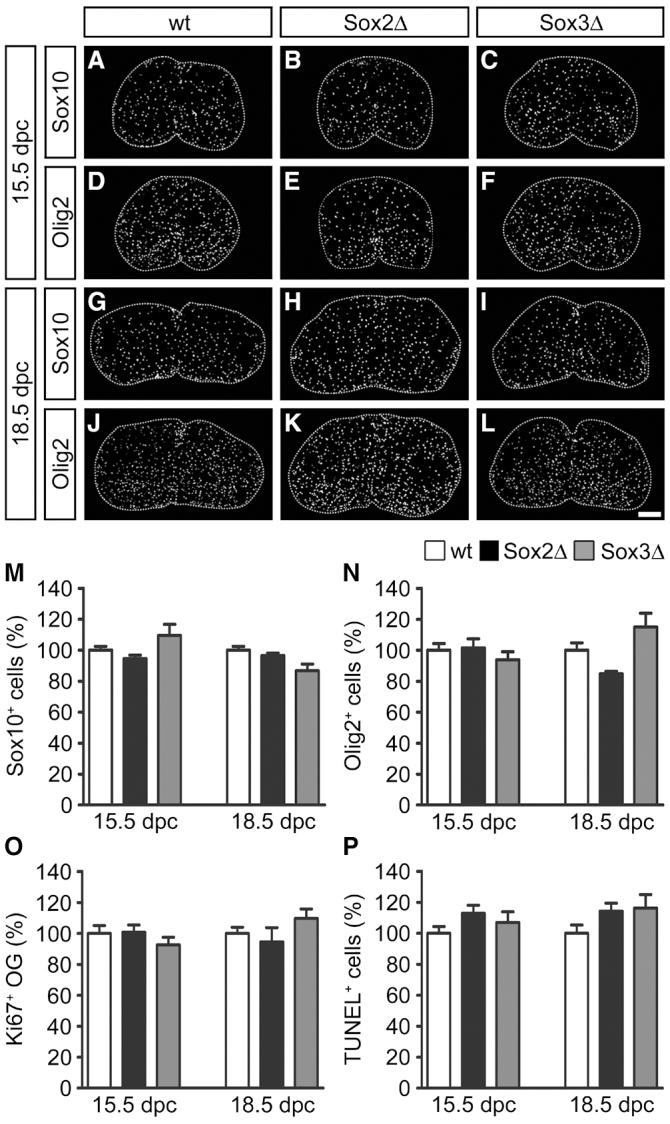
OPCs are normal in the absence of Sox2 and Sox3. (A-L) Immunohistochemistry on transverse sections of wild-type (A,D,G,J), Sox2ΔSox10 (B,E,H,K) and Sox3ΔSox10 (C,F,I,L) SC at 15.5 dpc (A-F) and 18.5 dpc (G-L) with antibodies against Sox10 (A-C,G-I) or Olig2 (D-F,J-L). Scale bar: 200 μm. (M-P) Quantification of Sox10-positive cells (M), Olig2-positive cells (N), Ki67-positive Sox10-expressing oligodendroglia (OG) (O) and TUNEL-positive cells (P). Cell numbers are presented as mean percentage ± s.e.m. relative to wild type (100%).