
Fig. 9.
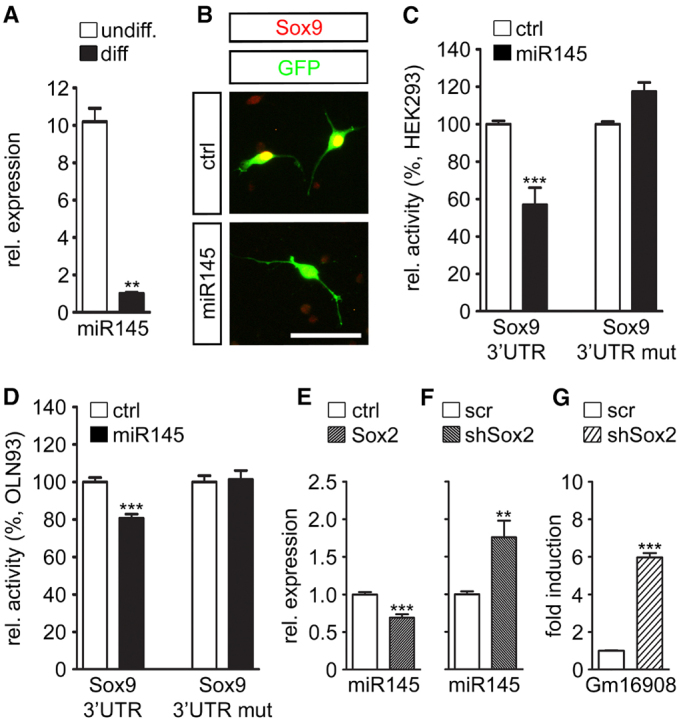
Cross-regulation of Sox2, miR145 and Sox9. (A) Endogenous expression of miR145 was assessed by qPCR on cDNA from undifferentiated and differentiated primary rat oligodendroglia. Expression ± s.e.m. is shown relative to U6 RNA as control, with values of differentiated cells set to 1. (B) Immunocytochemistry with antibodies against Sox9 (red) on primary OPCs electroporated with control (ctrl) or miR145 expression plasmid. Electroporated cells were identified by GFP expression (green). Scale bar: 50 μm. (C,D) For reporter gene assays, HEK293 (C) or OLN93 (D) cells were co-transfected with a fusion between luciferase and the Sox9 3′UTR in wild-type or mutant version and control (ctrl) or miR145 expression plasmid. Luciferase activity ± s.e.m. is shown relative to control (100%). (E,F) Endogenous expression of miR145 was assessed by qPCR on cDNA from transfected OLN93 cells overexpressing Sox2 (E) or depleted of endogenous Sox2 by shRNA (F). Expression ± s.e.m. is shown relative to U6 RNA with values of the respective controls set to 1. Numbers on the y-axis of E are also valid for F. (G) For reporter gene assays, OLN93 cells were co-transfected with a Gm16908-luciferase reporter and scrambled (scr) or Sox2-specific shRNA (shSox2) expression plasmids. Fold induction ± s.e.m. is shown relative to the scrambled control which was set to 1. **P≤0.01, ***P≤0.001 (Student’s t-test).