Fig. 1.
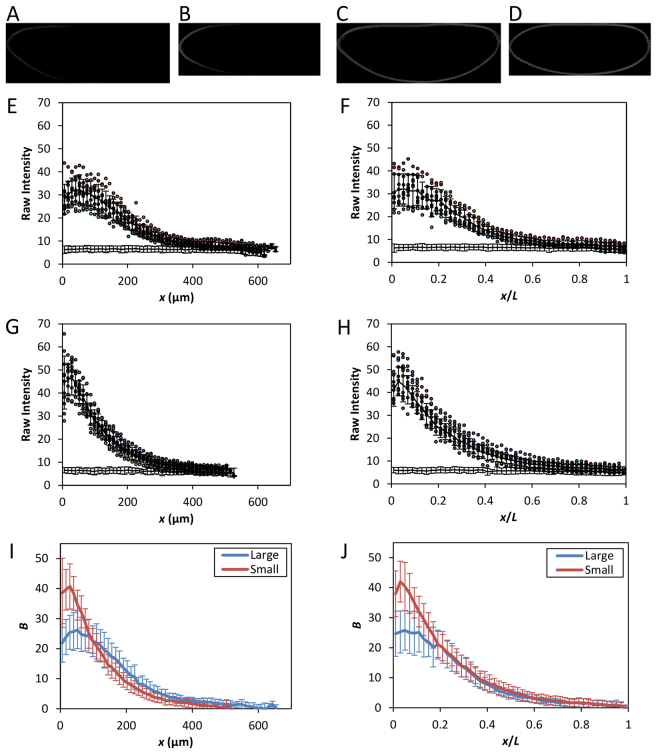
Bcd gradient properties uncharacteristic of embryo size. (A-D) Shown are midsagittal images of embryos from the large-egg line 2.49.3 (A,C) and the small-egg line 9.31.2 (B,D), detecting either Bcd (A,B) or nuclei (C,D). The intensities in the images shown were adjusted for presentational purposes only. (E-H) Extracted fluorescence intensities are plotted as a function of either x (E,G) or x/L (F,H). n=10 and 11 for lines 2.49.3 (E,F) and 9.31.2 (G,H), respectively. Mean intensity is shown as black line; error bars are s.d. Also shown are the relevant portions of the mean intensity (and s.d.) from bcdE1 embryos. (I-J) Mean Bcd profiles from the large (blue) and small (red) embryos as a function of x (I) or x/L (J). Error bars are s.d.

