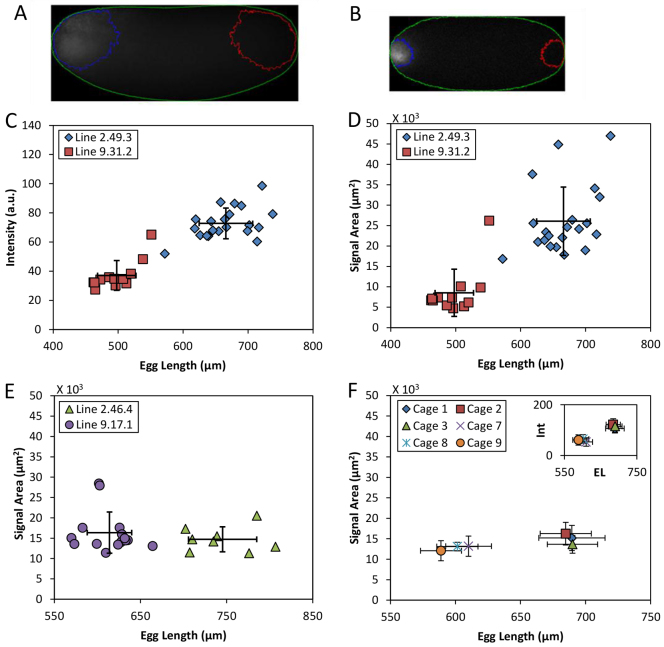
Fig. 4.
Quantification of bcd mRNA in early embryos. (A,B) Immunofluorescence images of embryos detecting bcd mRNA, showing embryo masking (green) and contour outlines for specific signals (blue) or background subtraction (red). Intensities in images shown were adjusted for presentational purposes only. (C) Scatter plot of fluorescence intensities (see Materials and methods) against L for the large (blue) and small (red) embryos under current investigation. (D-F) Scatter plots of the areas containing specific signals against L. Data are from the large (blue) and small (red) embryos under current investigation (D), or embryos from our previously published lines 2.46.4 (green) and 9.17.1 (purple) shown in panel E, and population cages shown in panel F. Inset in F shows mean intensities against mean L. Error bars are s.d.

