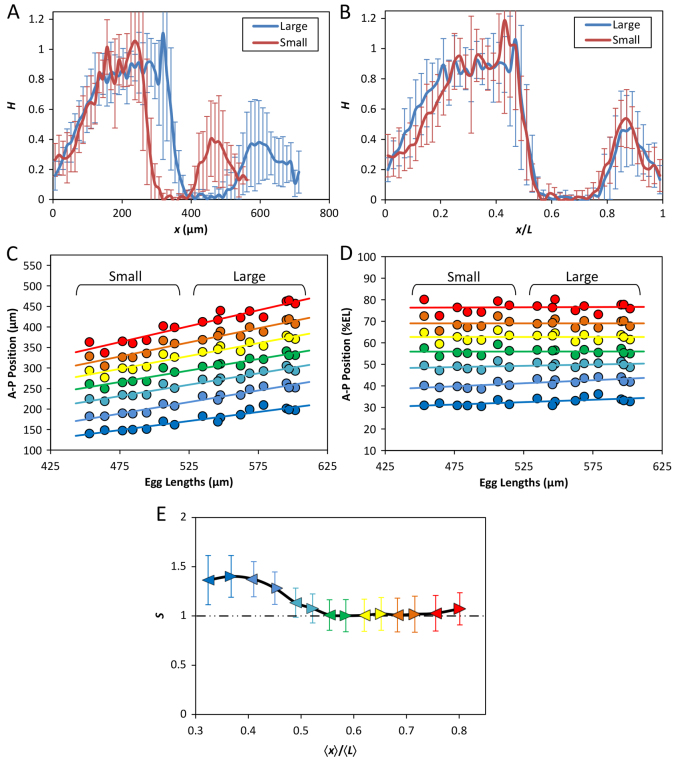
Fig. 6.
Robust expression patterns of hunchback and even-skipped. (A,B) Mean profiles (with s.d.) of FISH intensities detecting hb mRNA as a function of x (A) or x/L (B). n=10 and 7 for the large and small embryos, respectively. See supplementary material Fig. S3 for data from individual embryos. (C,D) Scatter plots of detected eve expression boundary positions against L. Either absolute (C) or relative (D) AP positions of the anterior boundaries of each of the seven stripes are shown. Linear regression is shown for each boundary. (E) Scaling coefficient profiles of eve expression boundaries in the large and small embryos. For this analysis, both the anterior and posterior boundaries (shown as arrowheads) of each eve stripe were used, with color code being the same as in C and D. Error bars represent 95% confidence intervals from linear regression (Cheung et al., 2011).

