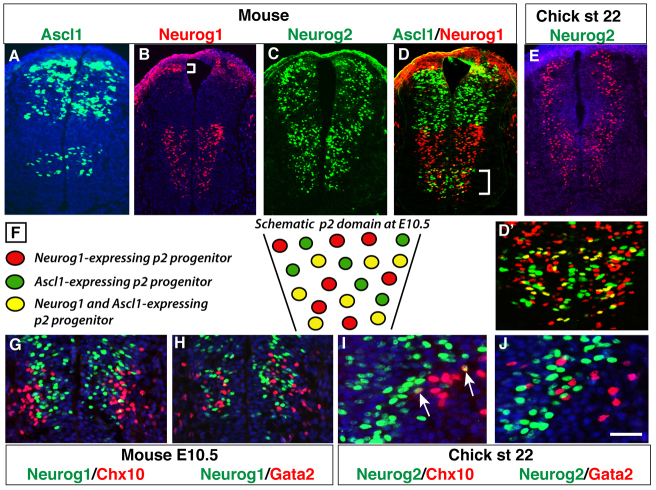
Fig. 1.
Mosaic expression pattern of proneural factors in p2 progenitors. (A-D) As detected by immunofluorescence, Ascl1, Neurog1 and Neurog2 are expressed in distinct patterns along the dorsoventral axis of the developing mouse spinal cord at E10.5. The bracket in B indicates the dorsal domain of Neurog1 expression. (E) Chicken Neurog2 displays an expression pattern similar to that of mouse Neurog2 at stage 22. (D′) Magnified view of the p2 region marked in D. (F) Schematic illustration of the salt and pepper expression pattern showing progenitors that express only Ascl1 or Neurog1 and those that express both Ascl1 and Neurog1. (G-J) Co-expression analysis of Chx10 or Gata2 with Neurog1 in mouse (G,H) and with Neurog2 in chick (I,J) spinal cords. No overlap is observed except for occasional Neurog2 and Chx10 co-expressing neurons (arrows in I). Scale bar: 60 μm for A-E; 30 μm for G,H; 10 μm for I,J.

