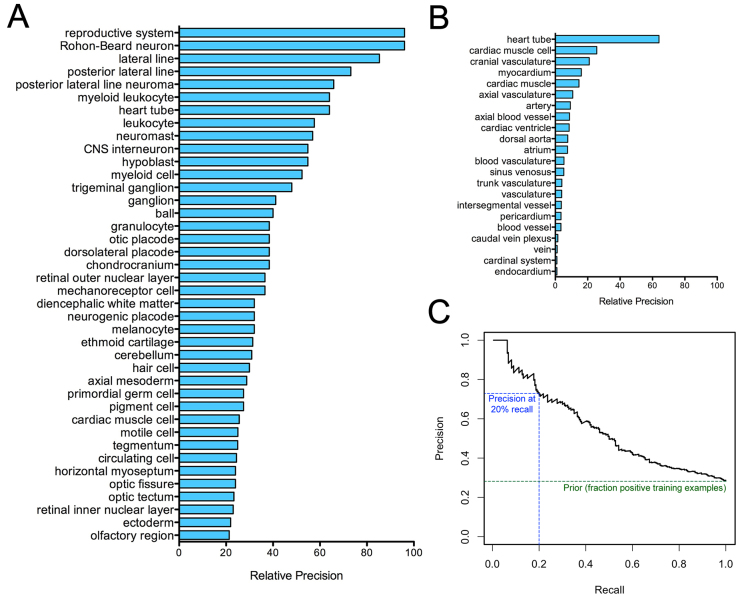
Fig. 2.
Cross-validation suggests high prediction accuracy over a range of phenotypes. Plotting relative precision [precision at 20% recall divided by the fraction of positive training examples (the prior probability); see Materials and methods] for phenotype predictors (A) reveals a diversity in high-scoring terms, with terms related to neural, sensory or cardiovascular phenotypes seeming to appear most frequently. Relative precision also shows substantial diversity among terms in the same general phenotypic category, as illustrated using cardiovascular phenotype terms (B). A precision recall plot of the term describing general cardiovascular phenotypes (‘cardiovascular system’) (C) shows a precision of 0.72 at 20% recall (blue line), with precision approaching the prior as recall approaches 100% (green line).

