
Figure 2.
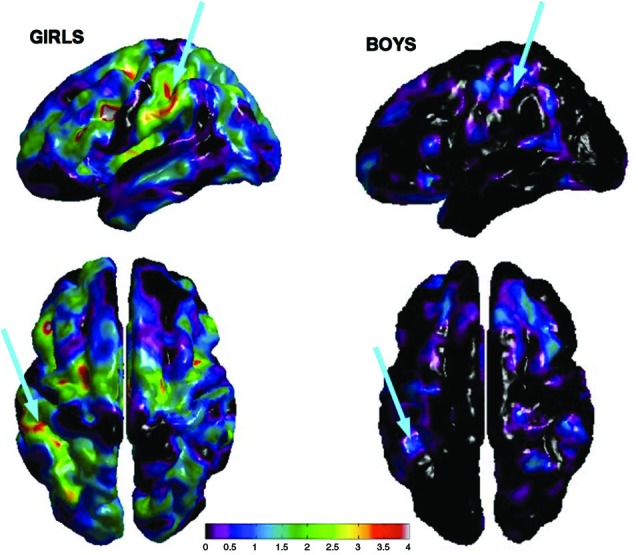
Cortical thickness maps of bilateral IPS showing peak correlation between performance on the transposed melody task and CT at Time 4 for girls (left) and boys (right) separately. Arrows show peak correlation in left IPS from both a lateral and dorsal angle.