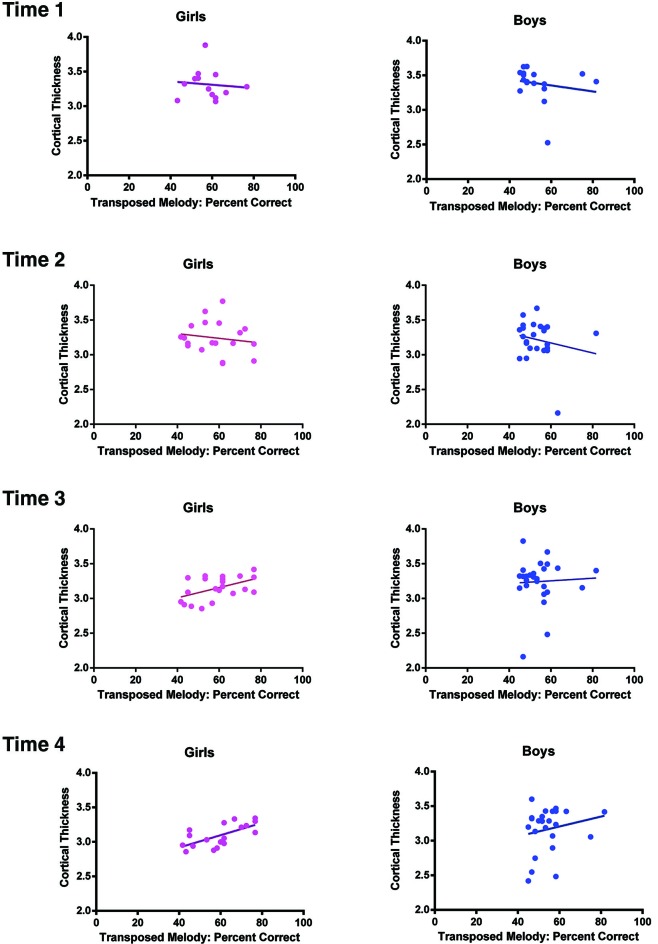
Figure 3.
Task performance on the transposed melody task plotted as a function of cortical thickness at the coordinates of the peak voxel in left IPS for girls (left) and the peak voxel in left IPS for boys (right) separately at each Time point. At Time 1, the correlation between CT and task performance was r = −.096, p = .76 for girls, r = −.176, p = .5 for boys; At Time 2, the correlation was r = −.157, p = .52 for girls, r = −.195, p = .36 for boys; at Time 3, the correlation was r = .49, p = .02 for girls, r = .05, p = .81 for boys; and finally at Time 4, the correlation was r = .66, p = .002 for girls, r = .2, p = .35 for boys.

