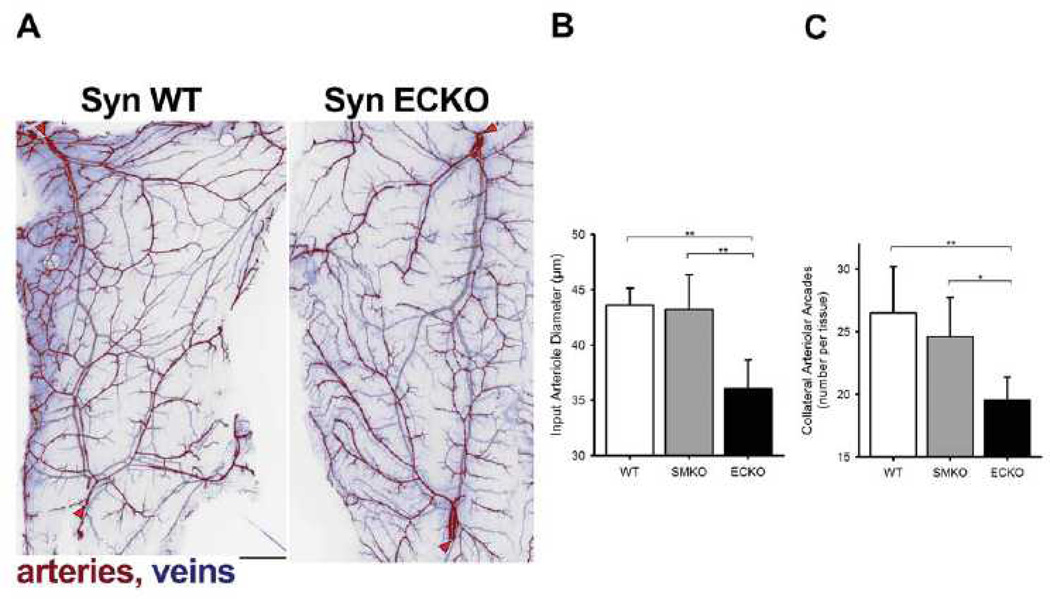
Figure 4. Quantification of arterial networks in mouse skeletal muscle.
(A) Fluorescent image of the caudal half of the mouse spinotrapezius. Pseudocoloring is used to indicate arteries (red) and veins (blue). Scale bar, 500 µm. Input arterioles entering the muscle are denoted by red arrowheads. Note extensive arcading arterial networks providing collateral pathways between the lateral (top left) and caudal (bottom left) input arterioles. The networks of spinotrapezius muscle vasculature in controls (SynWT) have a ramified arcade structure, with multiple arteriole arteriole linkage. Note that networks in SynECKO mice have a predominatly denditric structure with few arteriolar-level connections. (B) Diameter of the input arterioles as they enter the spinotrapezius. (C) Number of arcades in the caudal collateral spinotrapezius arterial network. Wild type mice, n=10; SynSMKO and ECKO mice, n=6. ANOVA with Tukey’s HSD post-hoc test analysis: *, p<0.05; **, p<0.01.

