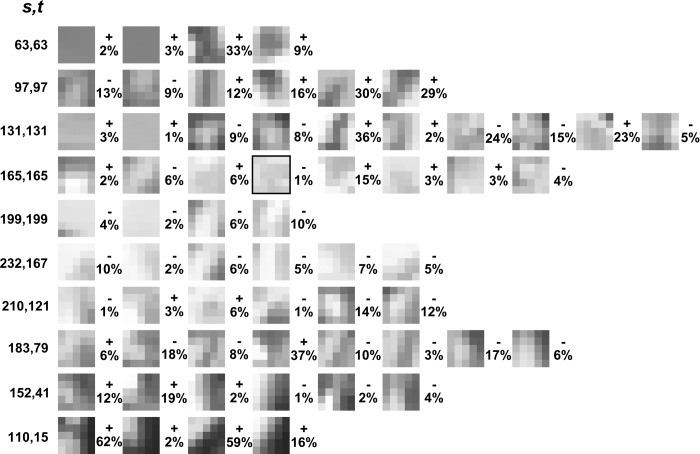
Figure 5.
Test image patches. Shown are the 5 × 5 test patches that were randomly sampled from the regions of (r, s, t, u) space given in Figure 4 (white circles in Figure 4). The numbers to the right of each patch give the percent error of the human estimate from the true value of the center pixel. The black box indicates the test patch for the psychometric functions shown in Figure 5a.

