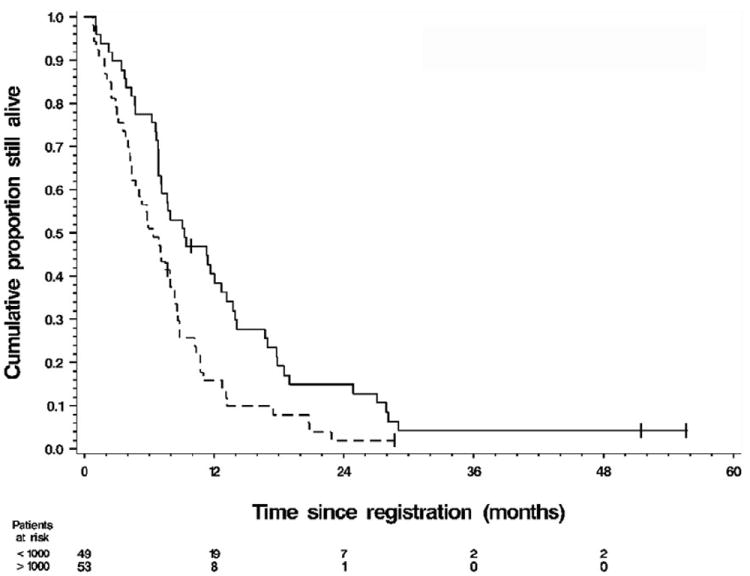
Figure 2.

Kaplan–Meier graph of overall survival (OS) by category of baseline carbohydrate antigen 19-9 (CA19-9) at levels (——) <1000 and (------) >1000. For the 49 patients with baseline CA19-9 < 1000 ng/mL the median OS was 9.1 months (90% CI 7.0–11.9) and the 1-year survival rate was 38% (90% CI 0.25–0.52). For the 53 patients with baseline CA19-9 > 1000 ng/mL the median OS was 6.1 months (90% CI 4.5–7.7) and the 1-year survival rate was 15% (90% CI 0.05–0.24). Log–rank test P = 0.0057. Of the 102 patients with a baseline CA19-9 measurement, 97 had died.
