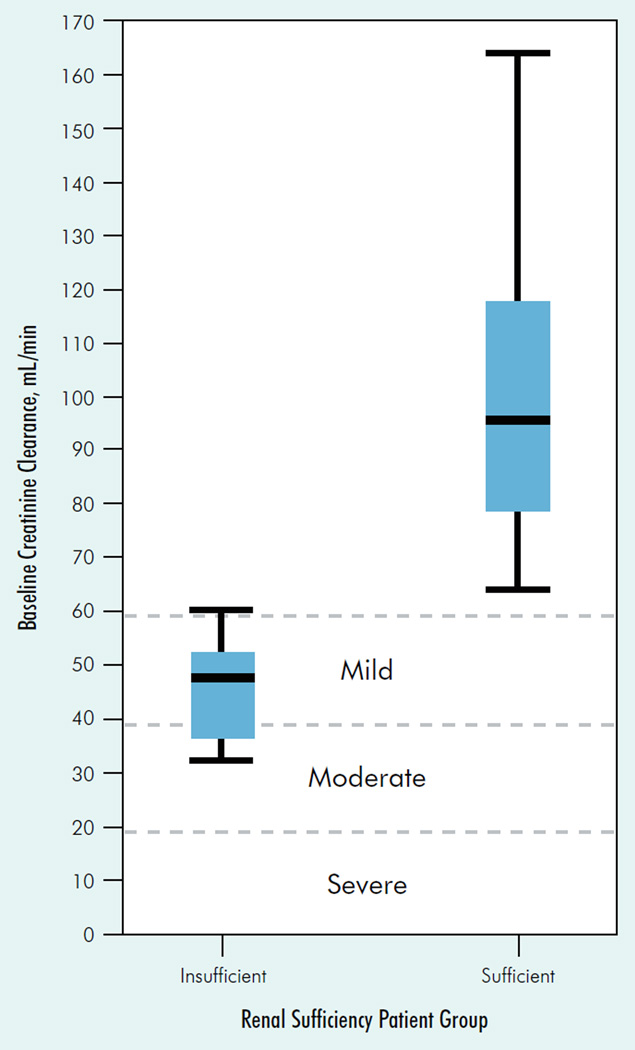
Figure 1. Ceatinine Clearance Distributions for Normal Renal Function and Renally Insufficient Patients.
On the x-axis, our study definition of renal insufficiency is CrCl ≤ 60 mL/min, and renal sufficiency is CrCl > 60 mL/min. On the y-axis, the 3 dashed reference lines indicate the upper limit of the successively poorer categories of renal dysfunction as defined by Miller et al19: CrCl ≤59 mL/min for mild; CrCl ≤ 39 mL/min for moderate; and CrCl ≤ 19 mL/min for severe renal dysfunction. For each box plot, the minimum and maximum baseline CrCl values in our study are marked at the end of the lower and upper vertical “whiskers,” respectively. The top and bottom of each box mark the 75th and 25th percentiles, respectively. The horizontal line within each box marks the median CrCl value.

