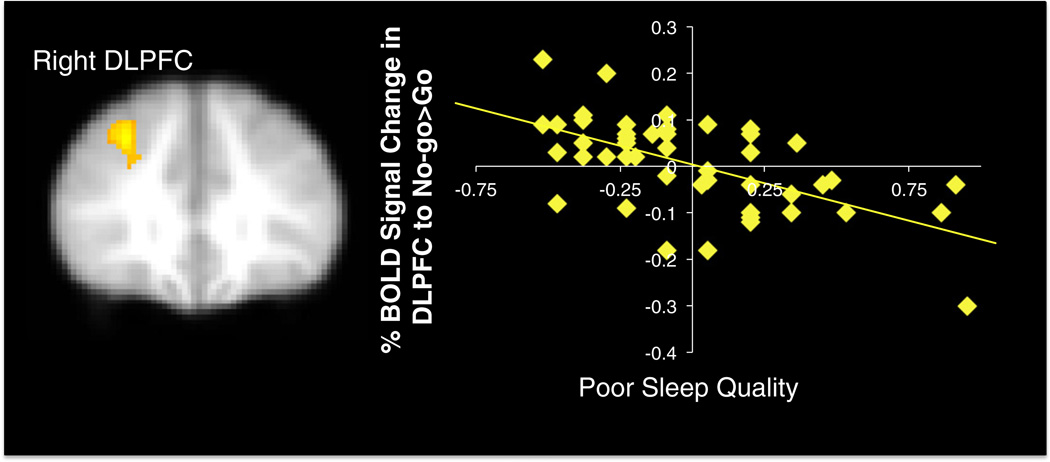
Fig. 3.
Percent signal change in right DLPFC to No-go>Go trials that correlated negatively with sleep quality. xyz=30 34 38, Z=3.81, k=441, p<.05 corrected. Note. Right=left. Greater values on the x-axis represent poorer sleep quality. Scatterplots are provided for descriptive purposes. All reported statistics are obtained from independent tests in FSL regressing sleep on brain activation.

