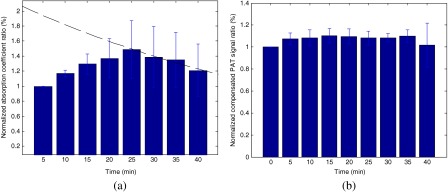
Fig. 6.

(a) The statistics of maximum DOT signal ratio change over time. The exponential fitting of the washout period of ICG is also shown. (b) The statistics of compensated PAT signal ratio change over time.

(a) The statistics of maximum DOT signal ratio change over time. The exponential fitting of the washout period of ICG is also shown. (b) The statistics of compensated PAT signal ratio change over time.