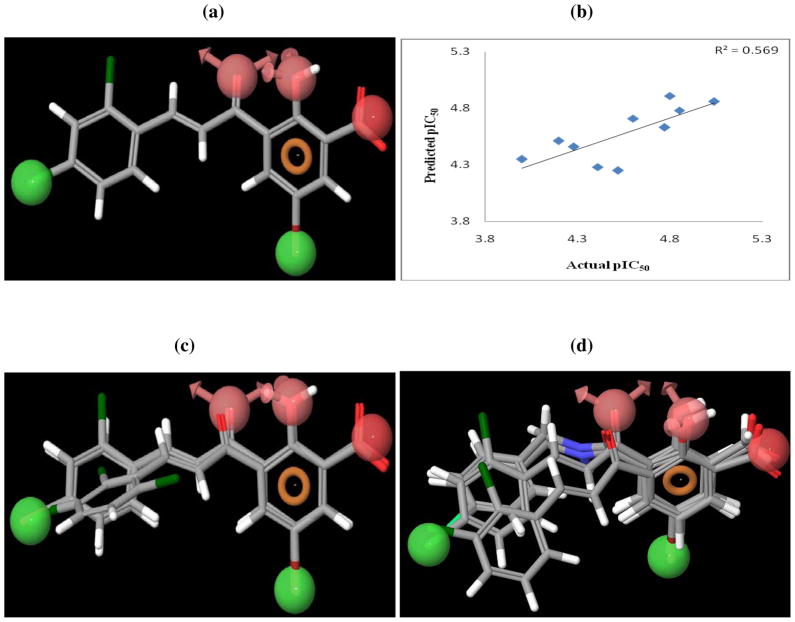
Figure 2.
The best pharmacophore hypothesis (AAHHNR) mapped onto (a) compound 17 (b) alignment of actives and (c) inactives from PHASE pharmacophore mapping. Pharmacophore features are: red spheres and vectors for H-bond acceptor (A), brown rings for aromatic groups (R), dark red spheres refer to a negative feature (N) and green spheres indicate hydrophobic groups (H). Atoms in the ligands are represented as O, red; Br, wine red; Cl, dark green; H, white; C, gray. (d) PHASE 3D-QSAR predictions of the test set.

