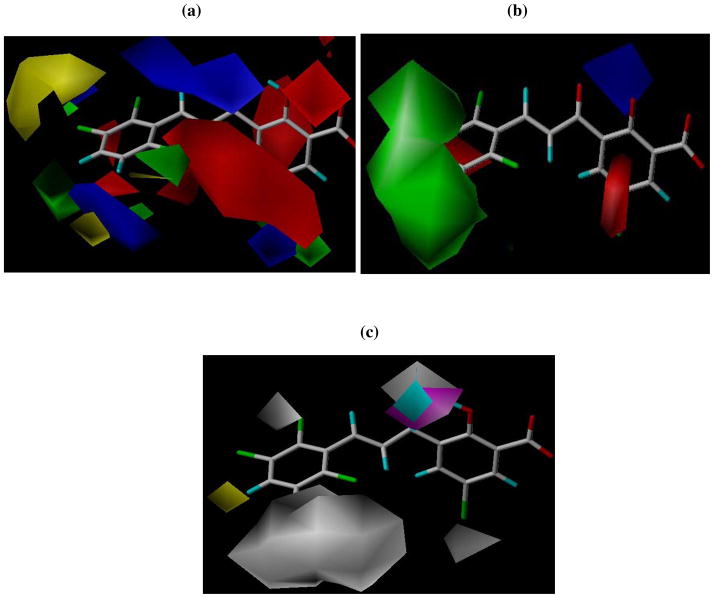
Figure 5.
(a) CoMFA and (b) CoMSIA steric and electrostatic contour plots. The green contours indicate regions where bulky groups increase activity, whereas yellow contours indicate regions where bulky groups decrease activity. Blue contours indicate regions where electropositive groups increase activity, whereas red contours depict regions where electronegative groups increase activity. (c) CoMSIA hydrophobic, H-bond donor and H-bond acceptor contour plots; white contours indicate regions where hydrophilic groups increase activity, whereas yellow contours indicate regions where hydrophobic groups increase activity, cyan indicates region where H-donors increase activity and magenta contour indicate region where H-bond acceptor groups increase activity.

