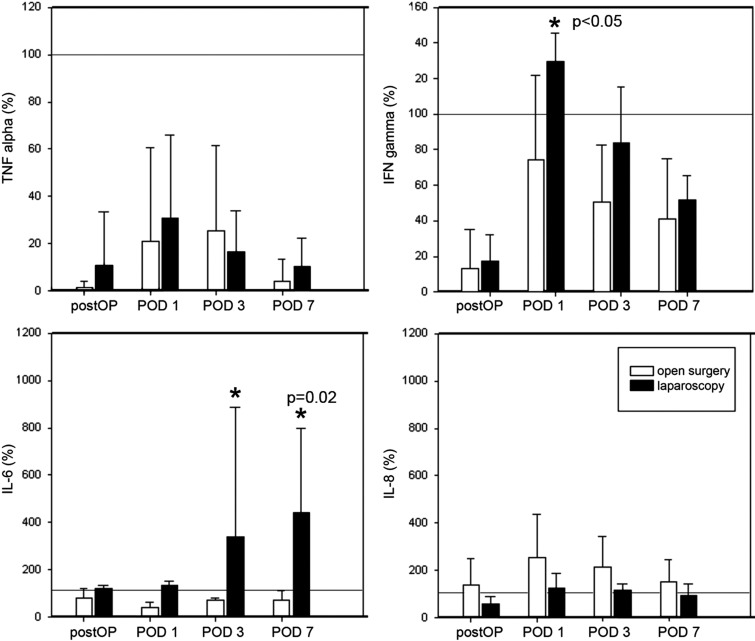
Figure 2.
Cytokine expression after whole blood induction with LPS endotoxin and 24 hours' incubation. The preoperative measurements were used as baseline values (100%). a, TNF-α showed a significant drop in both groups immediately after the operation (postOP), with a recovery on POD 1 and another relapse on POD 3, continuing on POD 7. b, IFN-γ levels showed an 80% decrease after surgery and an elevation on POD 1 above baseline in the laparoscopy group. Laparoscopy yielded higher IFN-γ values on all days (P > .05). c, IL-6 levels fell below the preoperative level in the open surgery group, with a minimum value on POD 1 and a slow increase on POD 3 and POD 7. After laparoscopy, a maximum 4.3-fold rise on POD 7 was visible (P = .02). d, IL-8 showed a persistent increase after open surgery, with a maximum value on POD 1 (2.3-fold) and a return toward baseline levels on POD 3 and POD 7. Laparoscopy presented an initial decrease (0.2-fold) and a light rise on POD 1 and POD 3, remaining constantly below open surgical values.

