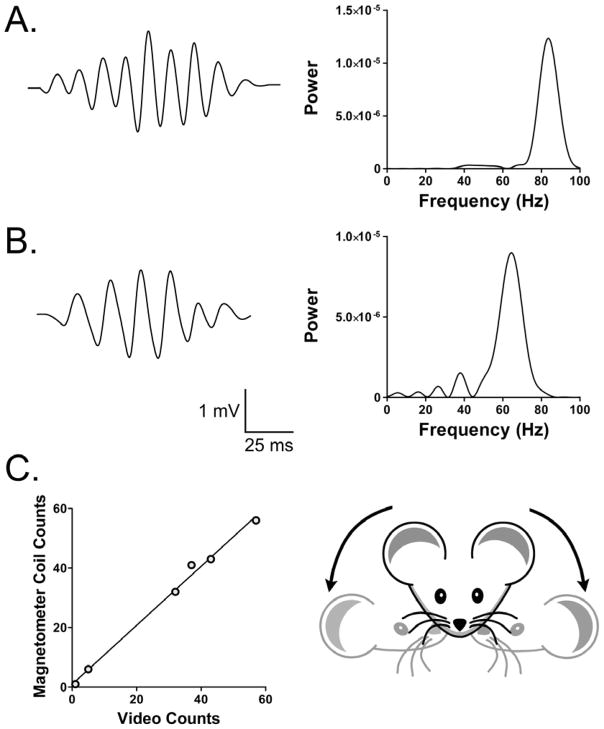
Figure 2.
(A, B) Magnetometer coil responses induced by head twitches. The left panels show the voltage response of the magnetometer coil, and the right panels are periodograms showing the spectral density of the responses. The response in (A) peaked at 83.8 Hz and the response in (B) peaked at 64.4 Hz. The magnetometer recordings were band-pass filtered (40–200 Hz) to attenuate the response to extraneous head movements and high-frequency noise. (C) Correlation between head-twitch counts in simultaneous video and the magnetometer coil recordings from 6 mice (r=0.997).

