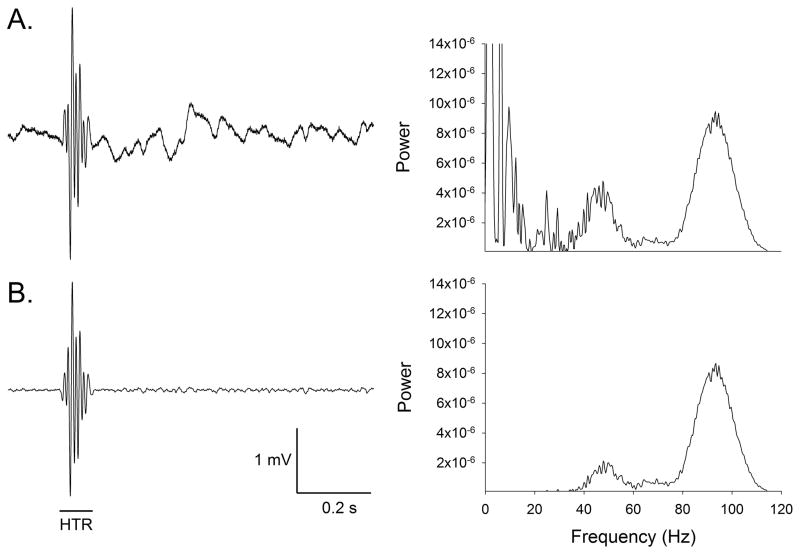
Figure 2.
Effect of filtering on magnetometer coil responses. The left panels show the voltage response of the magnetometer coil, and the right panels are periodograms showing the spectral density of the responses. (A) Unfiltered magnetometer coil responses. (B) Output of the magnetometer coil after band-pass filtering (40–200 Hz).

