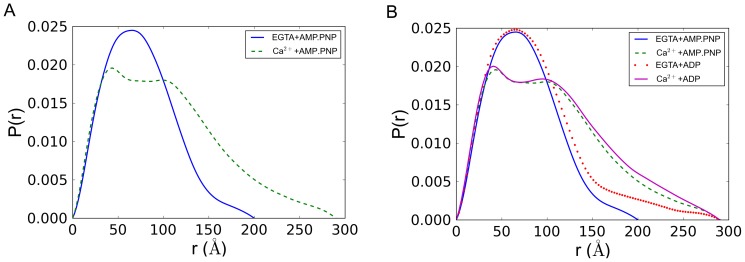
Figure 2. Pair distance distribution function of squid HMM derived from small angle x-ray solution scattering data.
The pair distance distribution function (denoted P(r)) function may be interpreted as the r2-weighted distribution of all possible electron pair distances within the protein. A) In the absence of calcium (EGTA+AMP.PNP), the protein assumes a unimodal P(r) distribution characteristic of a simple compact globular shape (solid line). In the presence of calcium (Ca2++AMP.PNP) the protein gives a more extended bimodal P(r) distribution indicating the presence of two separated domains (dashed line). B) Similar P(r) functions are observed when ADP is used instead of AMP.PNP. For comparison, curves are shown together with the same maximum diameter cutoff (Dmax) of 300 Å.

