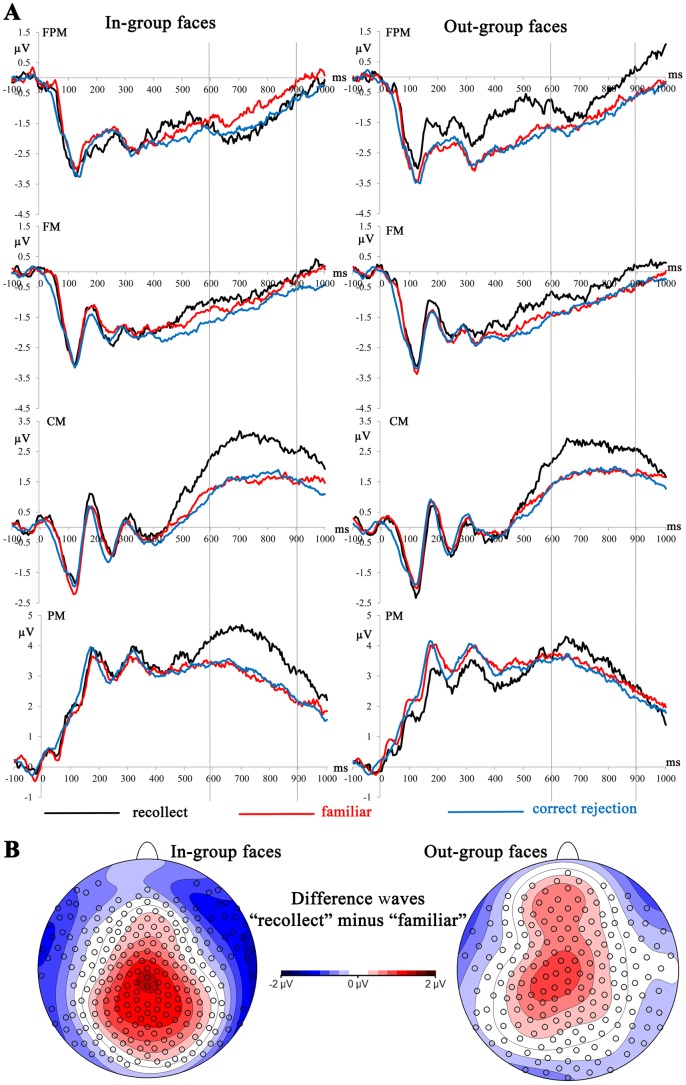
Figure 2.
A) Mean amplitudes from the test phase depicting recognition-related brain activation for “recollected” and “familiar” old faces and correctly rejected new faces for in-group and out-group faces. Vertical lines highlight the time segment from 600 to 900 ms used for statistical analysis of the parietal old/new effect. See Figure 1 for abbreviations of regions of interest and their locations. B) Voltage maps of ERP difference waves between “recollected” and “familiar” conditions showing the parietal old/new effect at 600-900 ms for in-group and out-group faces. Spherical spline interpolation was used.

