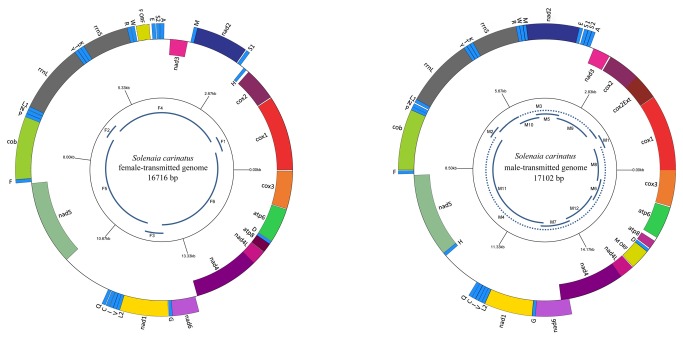
Figure 1. Gene maps of the F and M mitochondrial genomes of Solenaia carinatus.
Genes illustrated on the outside of the main circle are encoded on the light (L) strand; genes on the inside of the circle are encoded on the heavy (H) strand. tRNA genes are abbreviated by one-letter code of the amino acid (S1 = tRNASer (ucu), S2 = tRNASer (uga), L1 = tRNALeu (uag), and L2 = tRNALeu (uaa)). The inner circle: solid lines represent the sizes and relative positions of amplified and sequenced fragments; the dotted lines represent the fragments that can be amplified but cannot be sequenced directly.

