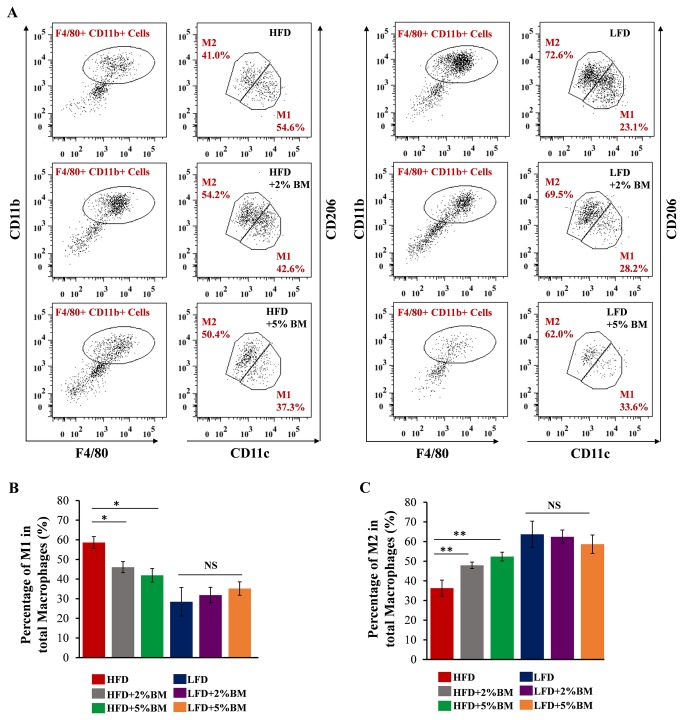
Figure 4. BM induced phenotypic switch in macrophage polarization in EAT of mice.
(A) Analysis of SVF cells for M1 and M2 macrophage. SVF cells were stained with antibodies against F4/80, CD11b, CD11c, CD206, and analyzed by flow cytometry. Samples were gated for F4/80+ CD11b+ cells, then examined for coexpression of CD11c or CD206. M1 and M2 macrophage and their percentage were indicated in red. (B and C) Quantitation of percentage for M1 and M2 macrophage in total F4/80+ CD11b+ cells. Statistical difference between groups is shown using a nonparametric Mann-Whitney test. n=6 per group. *P<0.05, **P<0.01. All data in (B)-(C) are means ± SEM.

