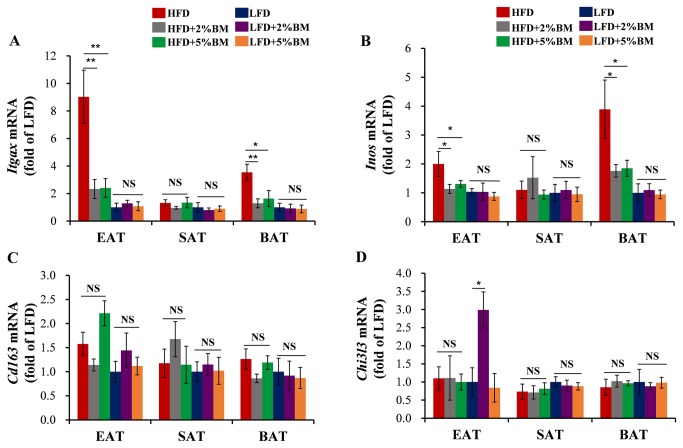
Figure 5. BM inhibited subset change of macrophages in EAT and BAT of mice.
The M1 marker gene expression of macrophages Itgax (A) and Inos (B) in EAT, SAT and BAT of mice. The M2 marker gene expression of macrophages Cd163 (C) and Chi3l3 (D) in EAT, SAT and BAT of mice. Statistical difference between groups is shown using a nonparametric Mann-Whitney test. n=8 per group. *P<0.05, **P<0.01. All data in (A)-(D) are means ± SEM.

