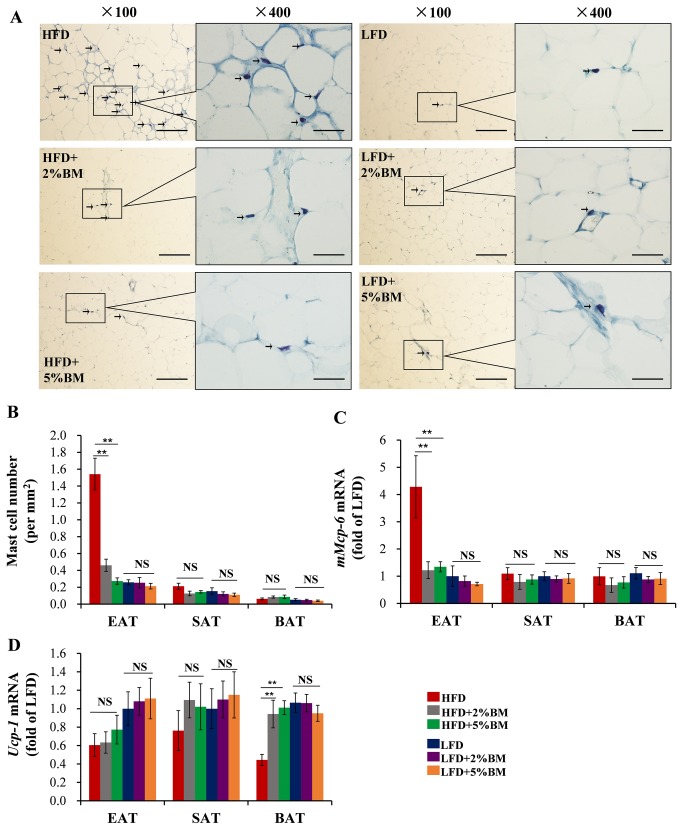
Figure 6. BM inhibited recruitment of mast cells in EAT of mice.
(A)Toluidine blue staining of mast cells in EAT of mice; arrows indicate toluidine blue staining mast cells; scale bars in (A), 100μm in length in low power views (×100) and 25μm in length in high power views (×400). (B) The quantification of the numbers of mast cells in EAT, SAT and BAT of mice. (C) The expression of mast cell marker gene mMcp-6 in EAT, SAT and BAT of mice. (D) The expression of energy expenditure marker gene Ucp-1 in EAT, SAT and BAT of mice. Statistical difference between groups is shown using a nonparametric Mann-Whitney test. n=8 per group. *P<0.05, **P<0.01. All data in (B)-(D) are means ± SEM.

