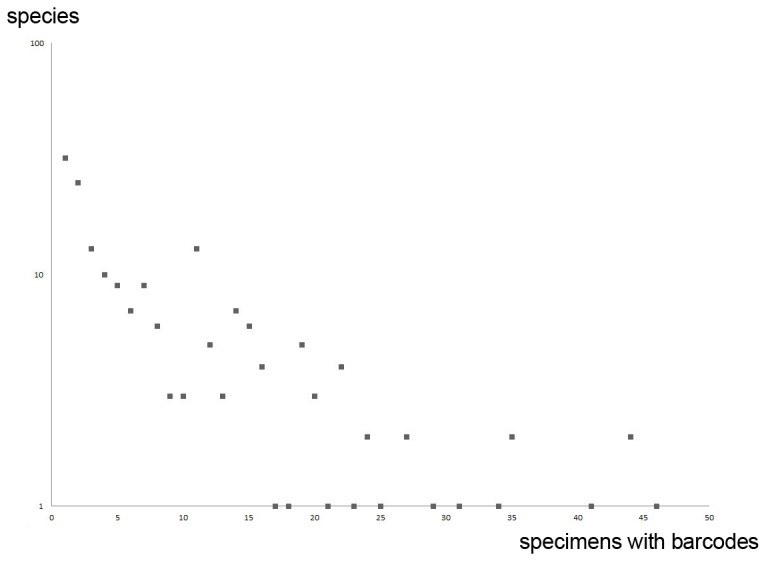
Figure 1. DNA barcoded specimens per species.

Sampling statistics for the 1610 barcoded individuals (>500bp; from European countries) belonging to 183 species. On average there were 8.8 DNA barcodes from European specimens per species. However, 32 species were represented by a single DNA barcode, while the most heavily analyzed species had 46 records.
