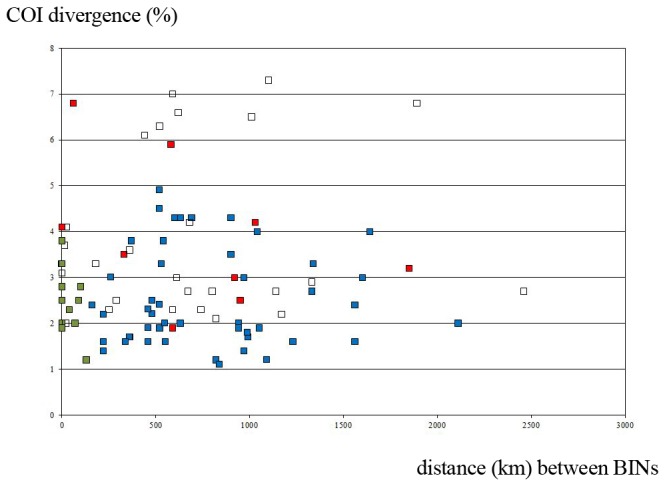
Figure 4. Intraspecific BIN splits: genetic distance versus shortest distance between records of both BINs.

Genetic distance was measured by the minimum pairwise K2P distance (expressed as a percentage) and plotted against the shortest distance (in km) between the capture location of specimens from the two BINs. In species with multiple BIN-splits all possible combinations were included producing a total of 93 comparisons. Blue and green dots: BIN clusters with more than one specimen in Europe – green: sympatric – blue: allopatric – unfilled: one of the BINs based on one singleton; cf. exact tables in Appendix S1 and Appendix S4 – red dots: as in unfilled dots one of the BINs based on a singleton in Europe but with additional specimens outside Europe.
