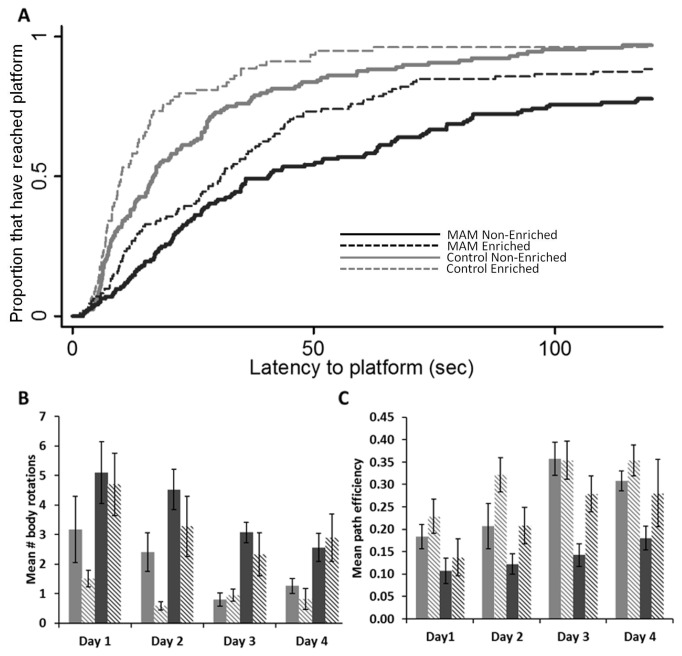
Figure 2. Morris water maze performance data for control and MAM treated rats.
(A) Survival analysis representing the fraction of animals that have found the platform during a trial, capped a 120 seconds. The effect of day has been modeled in. The solid black line represents MAM non-enriched, the dotted black line represents MAM enriched, the solid grey line represents control non-enriched, and the dotted grey line represents control enriched. Controls were shown to outperform MAM animals (p<0.001), and enriched animals outperformed their non-enriched counterparts (p<0.026). (B) Mean number of body rotations, averaged per day. Higher numbers of rotations indicate less certainty in the where the platform is located. The solid grey bar is control non-enriched, the diagonally segmented grey bar is control enriched, the black solid bar is MAM non-enriched and the diagonally segmented black bar is MAM enriched. Controls had fewer body rotations than MAM (p<0.001), and enriched animals had fewer rotations than non-enriched (p<0.024). (C) Mean path efficiency per day. Path efficiency indicated the directness of the animal’s path to the platform, higher values representing a more direct path. Controls outperformed MAM (p<0.001), and enriched animals outperformed non-enriched (p<0.007).

