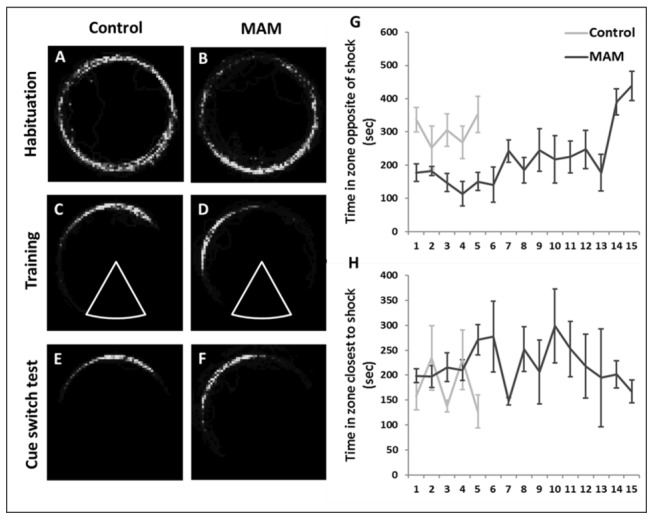
Figure 4. Analysis of the movement of control and MAM rats during the place avoidance test.

A-F are dwell-time maps for individual animals where lighter colors indicate more time spent in that area. During habituation, both control (A) and MAM (B) explored the perimeter of the arena. In the sessions in which the animals met criterion, controls (C) avoided in the region directly opposite the shock zone (arc). MAM (D) avoided to the left of the shock zone where there was increased risk of shock. (E-F) The avoidance behavior did not change when the local cues where transposed. Control animals spent more time in the zone opposite the shock zone (p<0.001(G)), while MAM animals spent more time in the zone closest to the shock zone (left) (p<0.001(H)) throughout the sessions.
