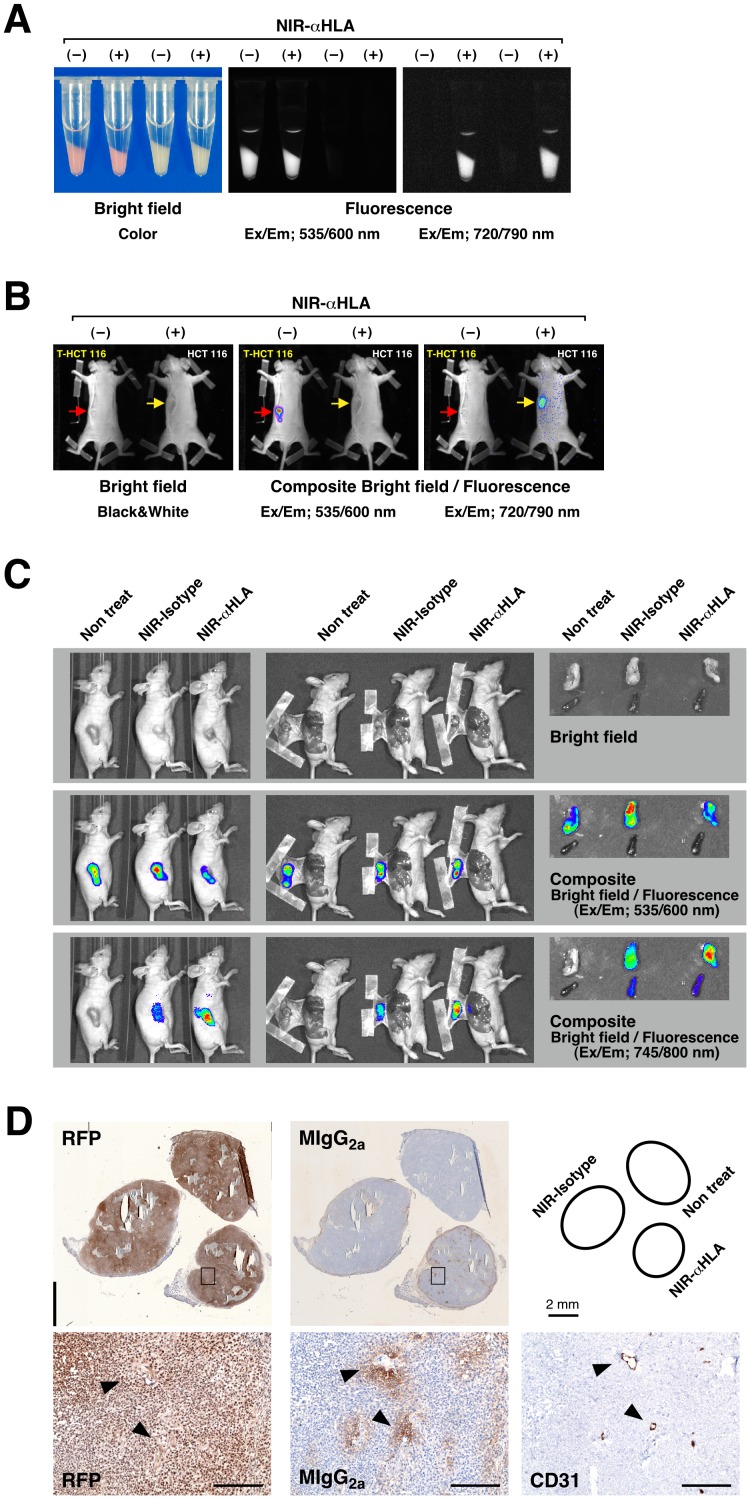
Figure 3. Validation of in vivo imaging of human tumors with the NIR-conjugated macromolecule probes.
(A) Bright-field images and fluorescence images of the T-HCT 116 cells (which express tdTomato) and HCT 116 cells in vitro. Fluorescent signal from the orange-red fluorescent protein tdTomato and the NIR-αHLA probe were specifically detected at wavelengths of 535/600 nm and 720/790 nm, respectively. The absence or presence of the NIR-αHLA antibody is indicated as NIR-αHLA (–) or (+), respectively. (B) In vivo fluorescence images of T-HCT 116 and HCT 116 tumor-bearing BRG nude mice. The NIR fluorescence intensity 2 days after iv injection of the NIR-αHLA probe can be observed. Fluorescent signal from tdTomato and NIR-αHLA probe were specifically detected at wavelengths of 535/600 nm and 720/790 nm, respectively, using the Kodak In-Vivo Imaging System FX. The absence or presence of the NIR-αHLA probe is indicated as NIR-αHLA (–) or (+), respectively. The red and yellow arrows indicate engraftment sites of T-HCT 116 cells and HCT 116 cells, respectively. (C) Fluorescent signal of the NIR-conjugated macromolecule probes co-localized with tdTomato in T-HCT 116 cells in tumor-bearing BRG mice. The fluorescent signals at 535/600 nm and 745/800 nm were overlaid (composite) using Living Image software 4.1.3. Li; liver, Sp; spleen. (D) Immunohistochemical staining of dissected tumors; anti-RFP (RFP; left), anti-mouse IgG2a (MIgG2a; center), and anti-CD31 (CD31; right); Enlarged view of boxed area shown below. Arrowheads indicate same position the on serial section. Scale bar, 200 µm.

